Solar Photovoltaic

This page describes the solar photovoltaic work done on my house. I mention the choices I made and evaluate performance.

If you're looking for something to help you make decisions concerning the latest technology, then this page may not be a great source of information. But it could assist you in knowing what to consider and the challenges you might face if you are thinking of investing in solar photovoltaic panels.

The above photo is of some of the solar photovoltaic panels on my house, July 22, 2013.


 Preparation

BackgroundOpen accordion icon
When Norma and I first saw our future house in Savage, Maryland, one of the first things we noticed was the south-facing garage roof which was unobstructed by trees. "Wouldn't that be a nice place to put solar panels?"

About seven months after purchasing the house, I started looking into this more seriously. At a local environmental meeting, I met someone from my old gym who owned his own solar company. He gave me his card. I also spoke to our neighbors, Don and Sara, who showed me the photovoltaic (PV) panels and microinverters they had installed. "Photovoltaic" means the panels are used to generate electricity, as compared to "thermal" which is used to generate heat. They recommended a couple of companies to me. I also got a recommendation for a roofer from Ralph. I now had enough information to get started and the motivation to get the ball rolling.

In our first year, we used about 9,716 kilowatt hours (810 per month, 26.6 per day). It was estimated that high efficiency solar panels covering the south side of the garage could reduce our electricity consumption by 48%! Based on electricity costing $0.119 per kilowatt hour in November 2010, solar panels should reduce our electric bill by $568 per year. Note that we have oil heat and use electricity for our water heater, stove, and oven. We have no gas line running to the house.
Close accordion icon

Selecting companiesOpen accordion icon
When it comes to making a big purchase, I almost never check with just one company. So I interviewed salespeople from three companies. I also tried to contact a fourth but they were too slow to respond. Of the three, I went with Solar Energy World.

Having the right salesperson really makes a big difference. At Solar Energy World, I was first contacted by Geoff Mirkin, the vice president. Then I spoke to Brent Cotton, a man who could sell freezers to Inuits. Of the three salespersons I spoke to, all were friendly, professional, and knowledgeable. But Brent was best able to communicate his knowledge. Maybe it is because he has an engineering background and I have a math background. I almost felt like his talent was being wasted talking to just me...he should have been lecturing to a few hundred people in an auditorium.

But still, I am not one to just let a good salesperson sway me. I followed up with what he said, doing a little background checking on my own. The other companies wanted to sell me microinverters. I heard and read good things about microinverters. But Brent was the only one who told me I didn't need them. When a salesman tries to SAVE me money, my ears perk up. I spent a good deal of time investigating why microinverters are needed. For many situations, they are good...particularly in less than ideal situation, like when some panels get shade while others get sun. But my situation was a little different. The south side of my garage roof had no nearby trees to provide shade. The panels would be 20 degrees off due south according to Google Maps (azimuth 160 degree) and the solar access would be 98%. Additionally, if I went with Brent's suggestions, I would be buying the SunPower 230 monocrystalline photovoltaic solar panels. With 18.5% efficiency, these are the Cadillacs of the photovoltaic world (as of 2010). While most of what I read supported the use of microinverters, I decided to contact SunPower, explain to them my situation, and ask them for a recommendation. Their answer was almost the same as Brent's. Hence, I went with Solar Energy World.

Solar Energy World has a good reputation. They have an "A-" rating with the Better Business Bureau (as of November 2010). They also provided me with a list of references. I was confident I made the right choice.

But there was another consideration...my garage roof. When we bought the house in December 2009, we knew the garage roof was in need of work. It bowed in the center. There was no way I was going to spend thousands of dollars on solar panels and put them on a weak roof. It needed structural work. So I had to select a roofer. But while solar companies were more than willing to try and sell me their services, the same was not true of roofers.

In addition to Ralph's recommendation, I got several from the solar companies. A couple only did shingle work, not structural repair. Another was too busy to take on another job. A fourth said he would get back to me and never did. A fifth was just slow in getting back to me. With no real competition, I ended up going with Ralph's roofer, Adriano Candido.
Close accordion icon

Roof workOpen accordion icon
Adriano made a great impression. I climbed up on the roof with him and he gently peeled back some shingles. He showed me where the plywood beneath didn't reach all the way to cover the fascia in one place and how the fascia was thus rotting. He pointed out how the top support beam was a weak 2x8 board and how the 2x4 cross beams sometimes didn't reach all the way to the wall. Because the roof bowed, the south wall was pushed out a few inches. I told him that the roof would need to be strong enough to support 16 solar panels and mounting hardware, or four pounds per square foot. He suggested that the bowed 2x8 beam be replaced by an LVL beam. Some of the cross beams should also be replaced by LVL beams. He would push the south wall back in, replace the fascia with PVC board, and replace the plywood with 5/8th of an inch thick plywood (extra thick for roofs).

I did some reading about laminated veneer lumber (LVL) beams. Indeed, they are extremely strong and specifically made for supporting heavy loads. It sounds like they are the next best thing to steel when it comes to home construction, and in some ways, more environmentally friendly.

Hoping to be able to write off some of the cost of a new roof on my taxes, I wrote up a little statement for Adriano to sign. It basically said that in his professional opinion, the work he was doing on my garage was necessary to ensure it would safely support the weight of solar panels. This was indeed the case. My accountant had no problem with including the cost of the work done on my garage roof with the solar panels when submitting the application for the federal rebate.

In October 2010, Adriano and his crew of three spent about a week taking off the old roof, removing beams, installing new beams, installing new plywood, putting on new fascia, and installing a new roof. He actually did much more than this and I am just mentioning the highlights.

I was pleased with Adriano's work.

For me, the garage is my man-cave. I store my kayaks, tools, and weights there. It is my workshop and gym. So while spending $9,650 to get the roof fixed up may sounds expensive, I am more than confident it will now support the solar panels soundly and will last for decades to come.
Close accordion icon

Energy storage?Open accordion icon
With the system we were getting, if the power goes out, we also lose power because we are dependent on the utility company.

What about living off the grid? Here in Savage, that just isn't practical. Our power doesn't go out often and when it does, it usually isn't for long. We have a generator and while yes, that does use fossil fuel, the amount is trivial given the frequency it is used.

But suppose we did want to store our own energy. As of 2013, batteries are still expensive, have very limited life, and are not the most environmentally friendly things when they need to be disposed. Other options I thought about are compressed air and flywheels.

Compressed air energy storage systems can be built without rare materials, and can also be built to last a very long time, if the manufacturer chooses to do so. Compressed air energy storage systems can also be recharged and discharged very quickly. Some consider it "low-tech" due to its simplicity.
- from Compressed Air Energy Storage To Grow Dramatically Over The Next Decade

With an efficiency of more than 80 percent, it [flywheels] would rival the best storage alternatives, and come with a 10-year guarantee. And it would make a perfect complement to an off-grid house with a solar photovoltaic (PV) system, able to charge fully in five hours - within the charging time of most solar PV systems - and store 15 kilowatt-hours of power, enough to run a modest house from sunset to sunrise.
- from Turn Up the Juice: New Flywheel Raises Hopes for Energy Storage Breakthrough

As of 2023, we still just have a basic generator and the number of times I've probably only used it once or twice for a power outage.
Close accordion icon


 Installation

SunPower on garage in 2010Open accordion icon
After the structural work on the garage and its roof was completed in the fall of 2010, I signed a contract with Solar Energy World to get the panels installed. From here on out, I mainly worked with Danny Polk to get appointments scheduled.

I paid Solar Energy World a total of $24,485 for the 16 panels, inverter, and installation.

First, a Howard County inspector had to come out, inspect things, then grant a Residential Building Permit and Residential Electrical Permit.

Then, a significant amount of paperwork had to be completed. This is where it pays to hire a company that knows their stuff. With federal, state, county, and Solar Renewable Energy Credits (SRECs) helping out, I can get 63% of my initial investment returned just from these sources...that is, if the paperwork is filled out and submitted properly. These are the forms I filled out:
  • Maryland Solar Energy Grant Program, Photovoltaic Solar Grant
  • Maryland Solar Energy Grant Program Terms and Conditions
  • Pre-Qualification Form, Maryland Solar Energy Grant Program
  • Photovoltaic Solar Grant Application Form, Maryland Solar Energy Grant Program
  • Interconnection Agreement Certificate of Completion
  • Interconnection Request Application Form and Conditional Agreement to Interconnect
  • Energy Conservation Device, Solar Heating or Electric Production Certification Form
  • SRECTrade: EasyREC Enrollment Form

  • There were some problems when submitting paperwork to the Maryland Energy Administration. They returned my application more than once, saying it was incomplete. Apparently, they changed the forms without passing this information onto the solar companies. Kathryn and Jennifer helped me out with resubmitting the forms. These are the forms that must be received before I can be issued a state certification number generated by the Maryland Public Service Commission. The state certification number is needed prior to enrollment in SRECTrade.

    It took only a half day for guys to come out and install the panels on November 29, 2010. The brackets attach directly to the trusses so I suppose the extra thick plywood on the roof wasn't really necessary.

    On November 30, Phet and Mel installed the central inverter, a SunPower SPR-3000m. This is what converts the direct current (DC) power generated by the panels into alternating current (AC).
    1 / 2
    Garage inverter
    Inverter.
    2 / 2
    Close-up of garage inverter
    Close-up.

    According to the electrical data on the information sheet, the recommended array input power is 3,600 watts. With my 16 panels, each capable of generating 230 watts, the total maximum wattage is 3,680. This had me a little concerned but Jason Chretien, the Solar Energy World engineer, assured me that
    the "230" is the standard test conditions (STC) rating of the panels. The performance test condition ratings of the panels are slightly less than that, so we can actually fit more STC than stated on the spec sheet. We actually have your system sized to 98%.
    I also checked with SunPower, and their reply was
    No need to be concerned on this. The 3,600 watts is a mere recommendation; it can go over or under this value. The 3,680 is the STC rating and does not signify the actual wattage being as input [sic] to the inverter. Considering all derating for solar, the approximate input wattage in to your inverter would be 3,680 x 0.77 (General Derating for Solar) = 2,833 watts ready for conversion to AC Power by the inverter. So you should be ok.

    On December 7, someone from the county came out to inspect the electrical work done by Solar Energy World. Immediately after passing inspection, the system was activated.

    On January 5, I was given a written notice of final approval for my application for a level one interconnection from Baltimore Gas and Electric (BGE).

    On January 10, Jason set me up with a SunPower web page from which I could monitor my solar energy generation. This information is transmitted from my system to the internet via a SunPower Monitoring System Gateway (model SPR-PMR-GTWY). It all seemed pretty simple.
    Screenshot of SunPower web page

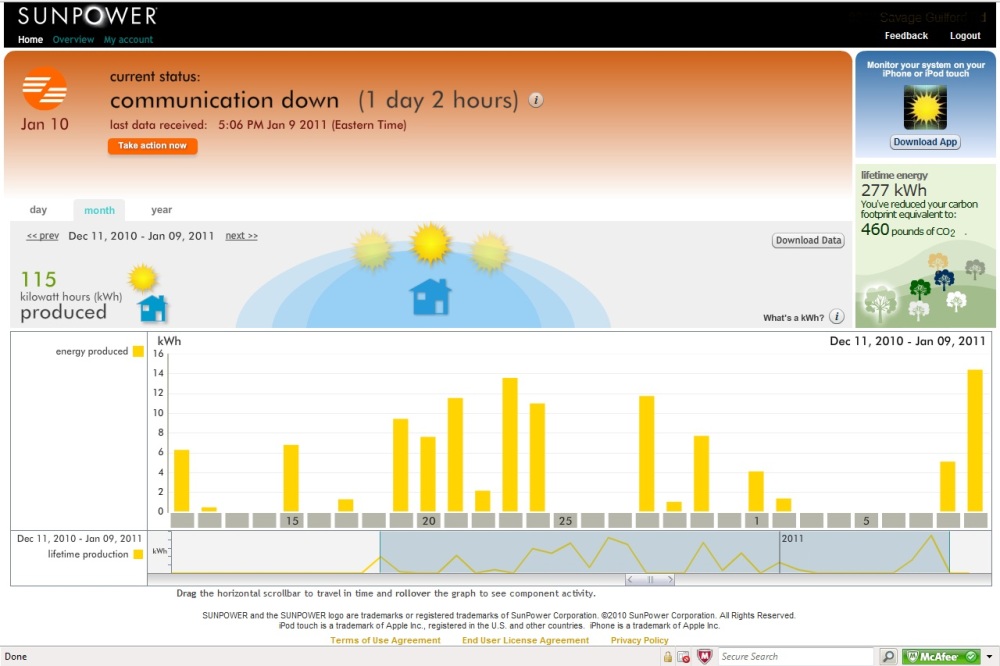
    On March 29, 2011, Eric Mooney told me that my account was set up for SREC Trade.

    On July 8, 2011, I finally received my Maryland Solar Energy Grant money.
    Close accordion icon

    Suniva on House in 2013Open accordion icon
    In the spring of 2013, I decided to get a solar thermal water heater. This was put on my house, not my garage. Since I don't believe in getting new solar panels put on a 20+ year old roof, I got a new roof. The solar thermal panels went on the south side. I decided to get more photovoltaic panels on the west side. My goal was to be net zero or as close to that as possible.

    For the additional photovoltaic panels, I interviewed many of the same companies I considered for my solar thermal hot water heater since these companies did both types of installation. But in the end, Solar Energy World got my business again. So on May 21, 2013, I signed a contract to get ten Suniva Optimus OPT260-60-4-1B0 260 watt monocrystalline solar photovoltaic panels for a total cost of $10,140. This includes installation and central inverters.

    Originally, I thought we would go with microinverters since the west side of the roof on my house gets partial sunlight blockage from trees late in the day. But Brent felt that central inverters would be better since we were still going with only one roof surface. That is, if the panels were spread out between the west and the south sides of my roof, then microinverters would be a better choice. Additionally, for these particular panels, the central inverter would also be better because the Enphase microinverter has a 215 watt maximum capacity which means we would be "clipping" power. For this case, the central inverter ensures optimal output.

    These panels face west by southwest, having an azimuth of 248 degrees. The roof has a slope of 27 degrees. Annual output should be 3,131 kwh/year. This factors in the fact that we have 89% solar access on the west roof, where they will be installed. This is nowhere as good as our south roof which has 100% or darn near close to that amount. This much energy generation means we should save money in the following ways:
  • Federal tax credit: $3042
  • Maryland Energy Grant: $1000; this was later denied.
  • Avoided electric costs per year: $350 based on June 2013 rates with Castlebridge ($0.111669 per kWh after taxes and fees).
  • SRECs: This amount fluctuates and will almost certainly go down over time. If my annual output is 3,131 kwh, then I will generate 3,131/1,000 = 3.131 SRECs per year. For 12 SRECs generated from December 7, 2010 to August 29, 2013, I earned $1,094.54 + $252.96 = $1,347.50 which averages out to $112.29 per SREC. If SRECs become worthless, I get nothing. And if they maintain their same rate, I get 3.131 * $112.29 = $351.58 per year for the sale of SRECs. Realistically, what I actually get will be between zero and $351.58, probably leaning towards the latter.

  • This being the case, the system should pay for itself somewhere between ($10,140 - $3,042)/($350 + $351.58) = 10.12 years and ($10,140 - $3042)/$350 = 20.28 years, depending on how well SRECs maintain their value. Brent expects I will get back more on SRECs and avoided electric costs so he is estimating the system will pay for itself in 7.2 years. Regardless, it is much harder to justify the purchase of photovoltaic solar panels without the Howard County tax credit that was in place when I purchased my first set of panels.

    On June 3, 2013, James Carpenter came by to do a solar site assessment.

    Later that month, Jason Chretien sent me a proposed layout for the panels. It wasn't at all what I wanted. The original drawing that Brent provided would have all 10 shifted as far as possible to the south side on the west roof of the house. This would allow Norma and me to grow a tree on the north half of the west side of the house without having to worry about shade from the tree getting in the way of the panels. The drawing I received on June 20, showed the panels much further to the north side than what was discussed. Jason revised the drawing but said that in order to get the panels further south, they would need to remove one of our roof ventilation pipes and attic fan. That was unacceptable. After some discussion, we came up with the configuration shown below.
    Schematic drawing of panel configuration

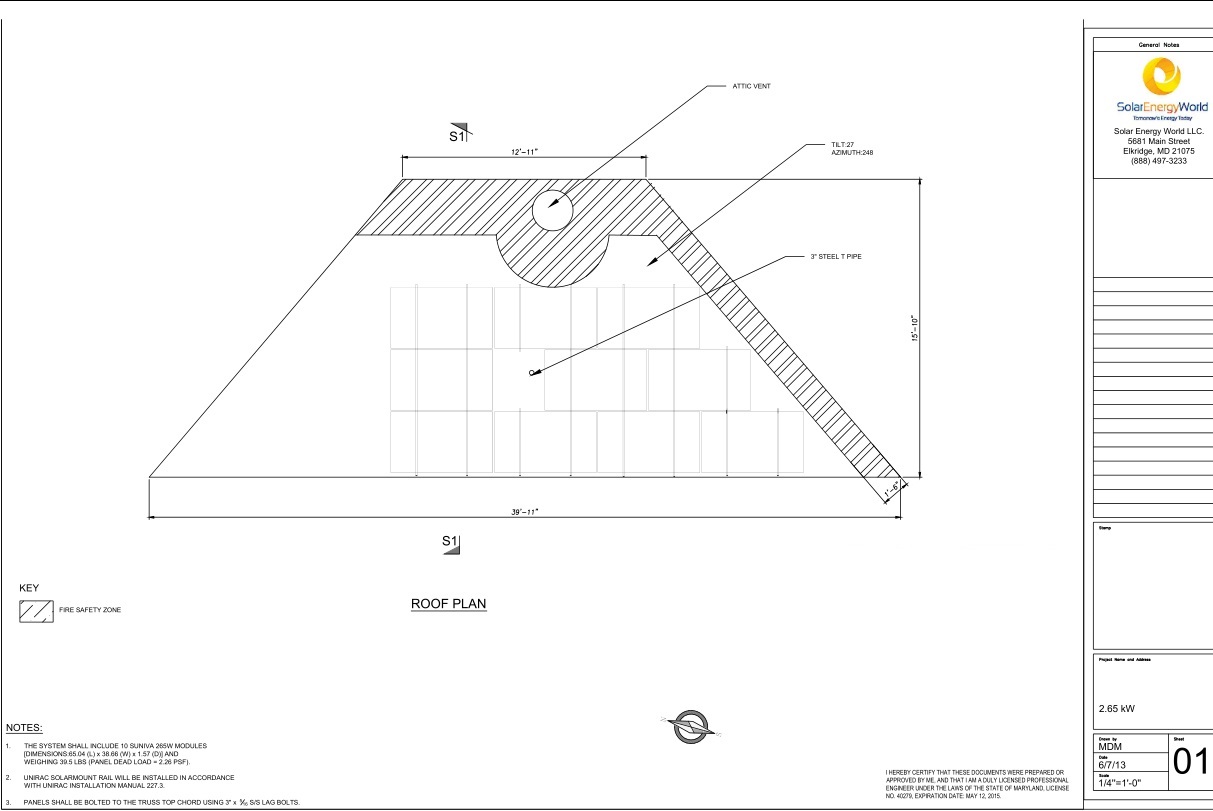
    The amount of sunlight at each position is illustrated in the following layout.
    Layout of panels showing how much sunlight they would collect

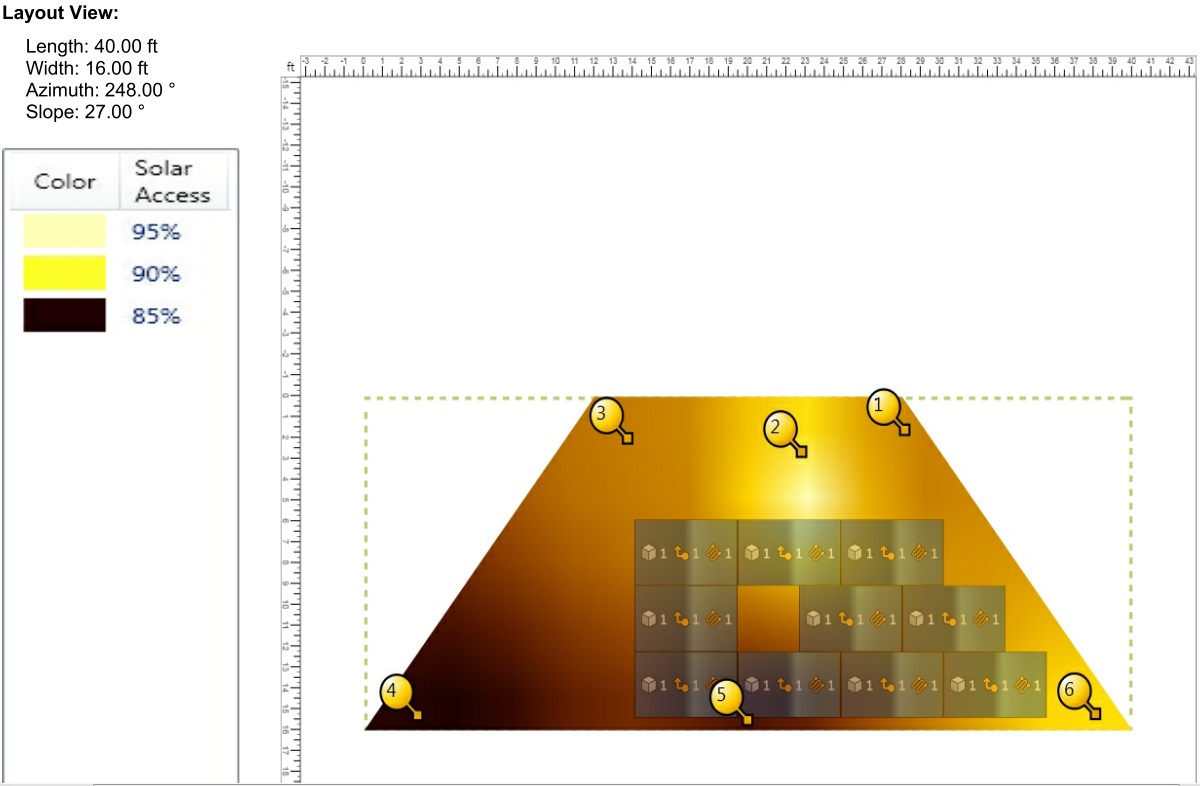
    The expected electricity generation broken down by month is shown below. This turned out to be a little less than I expected (3,062.7 kWh instead of 3,131 kWh) though only by 2%.
    Table showing expected electricity generation by month

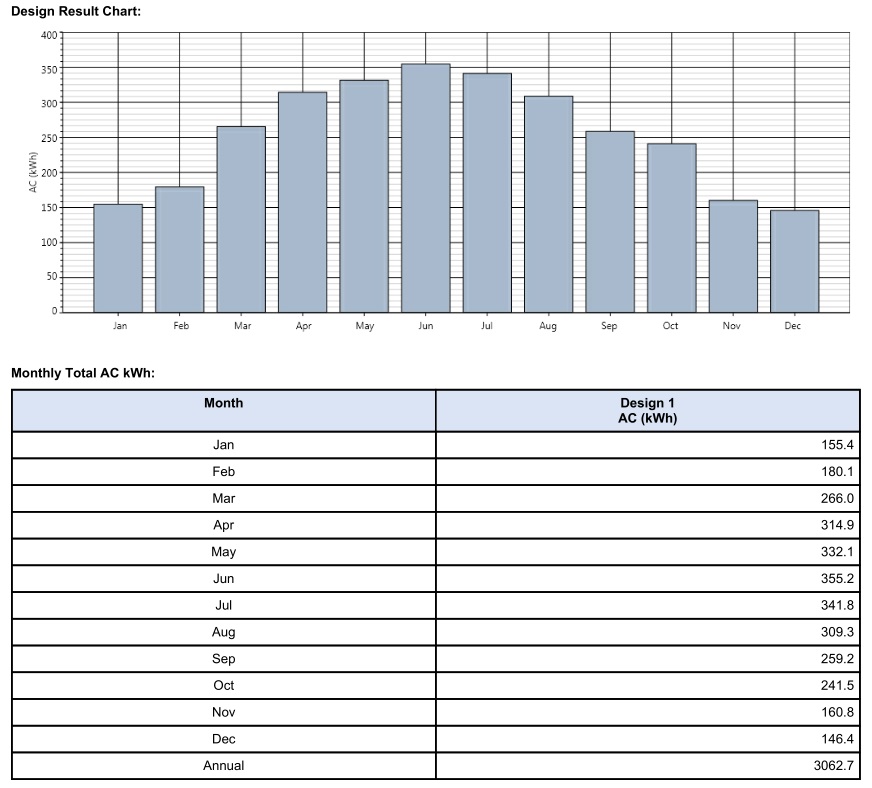
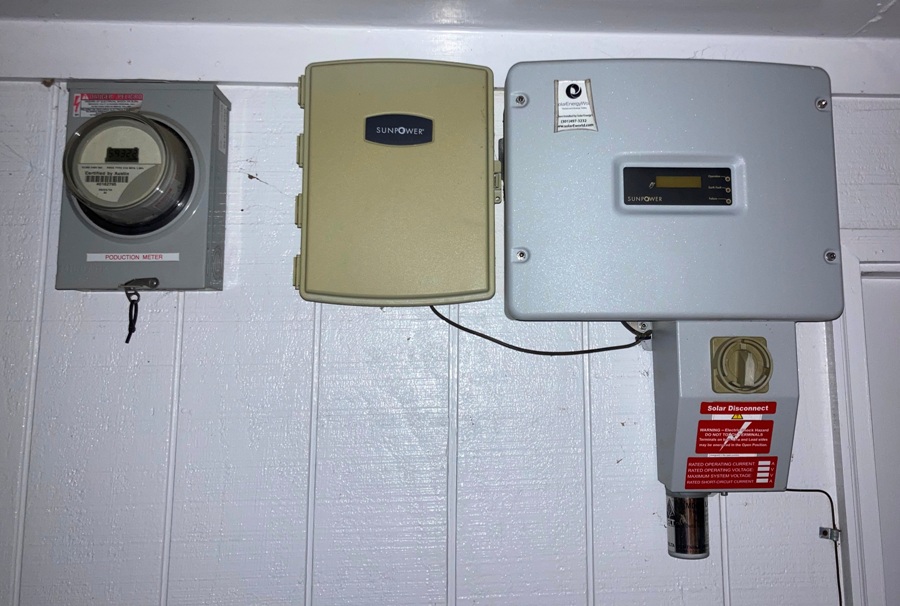
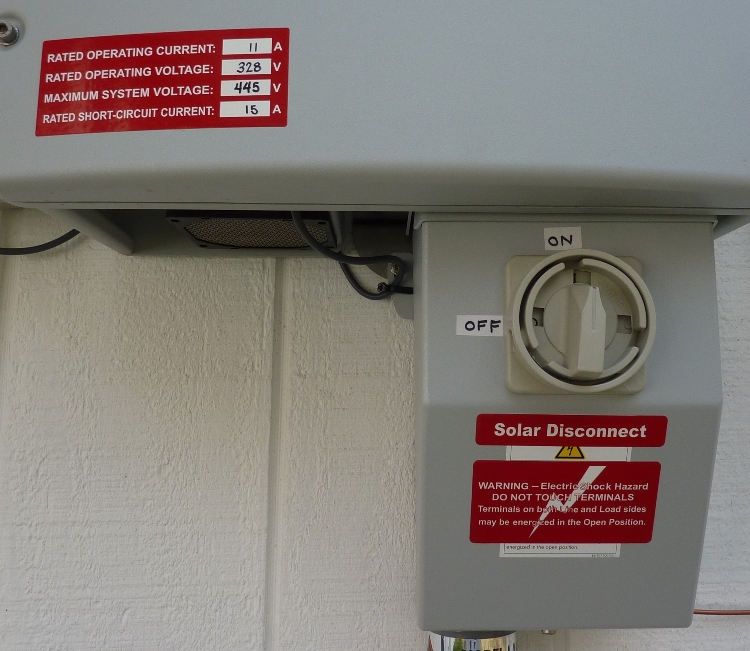
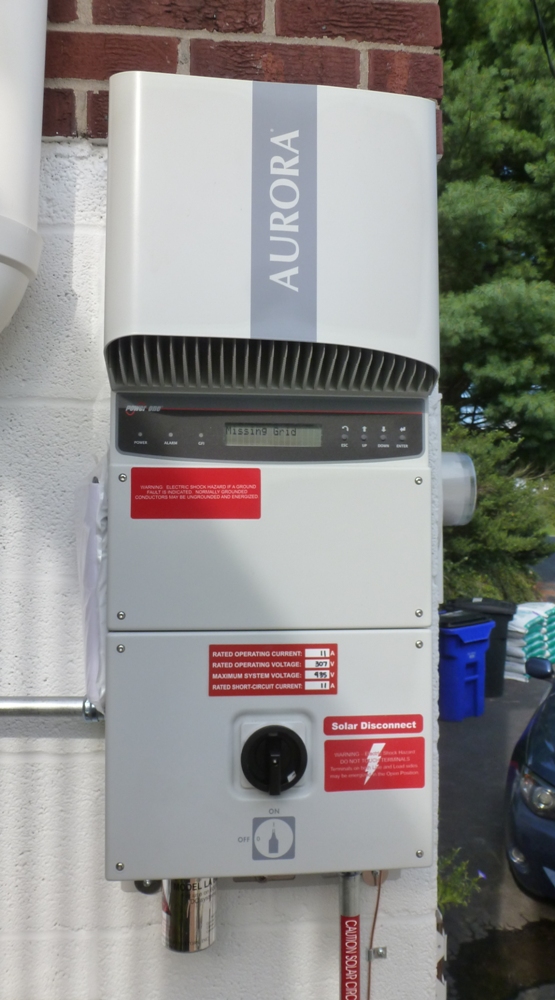
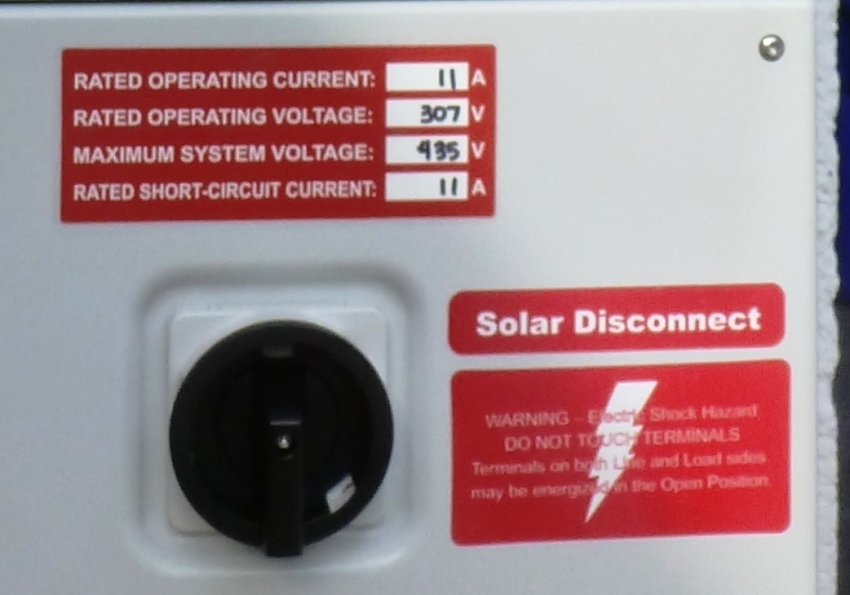
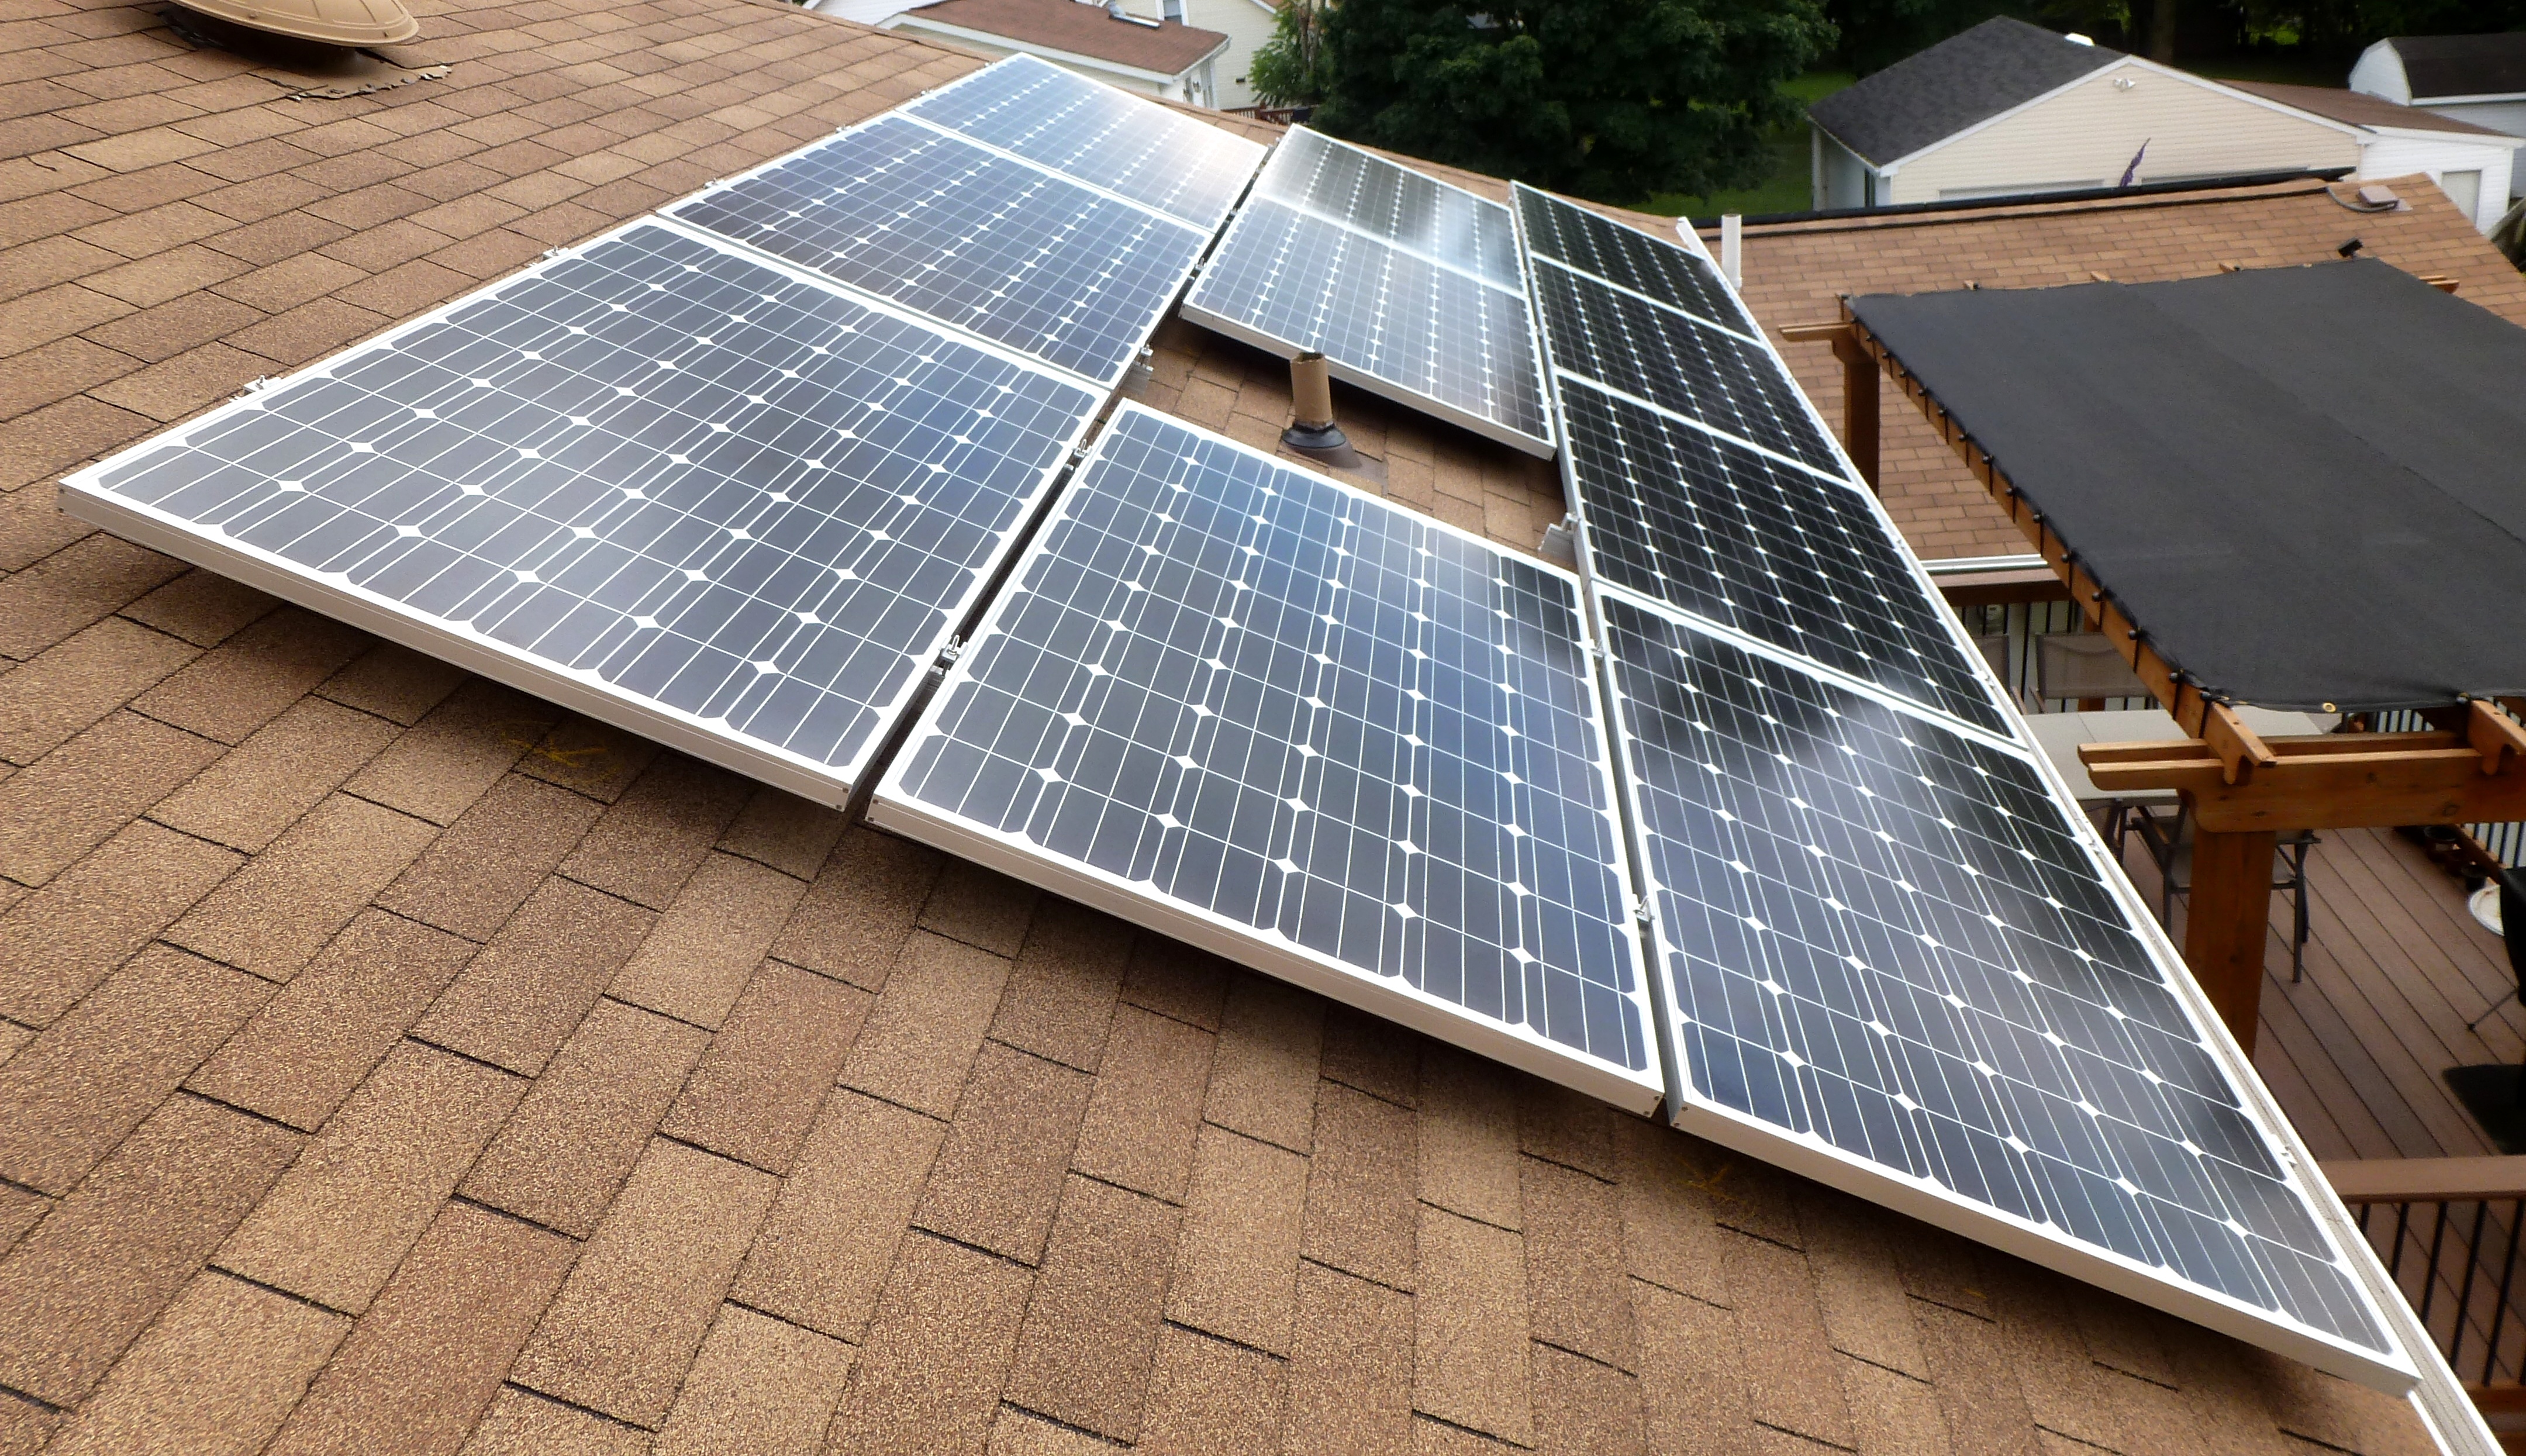
    The actual installation was done in half a day on July 19, 2013. A fellow by the name of Mark was in charge. He installed what they gave him which was ten Suniva 265 panels with the silver edges. I was expecting the all black panels but the silver edges were fine and hardly visible except except from much much further back in my yard. The silver edge panels actually have better output than the 260s that I was expecting so it all worked out fine in the end. See the photo at the top of the page.

    Mark's team also installed the Power One PVI-3.0-OUTD-S-US Aurora String Inverter 3000 Watt central inverter on the west side of my house at the south end.
    1 / 2
    House inverter
    Inverter.
    2 / 2
    Close-up of house inverter
    Close-up.

    Just below the house inverter was the electrical disconnect and production meter. This was placed next to the disconnect for the panels on my garage. Such disconnects are required by law to be accessible outside the house so the utility company can shut off my system when they work on the power lines. This protects the utility workers.
    Electrical disconnect and production meter

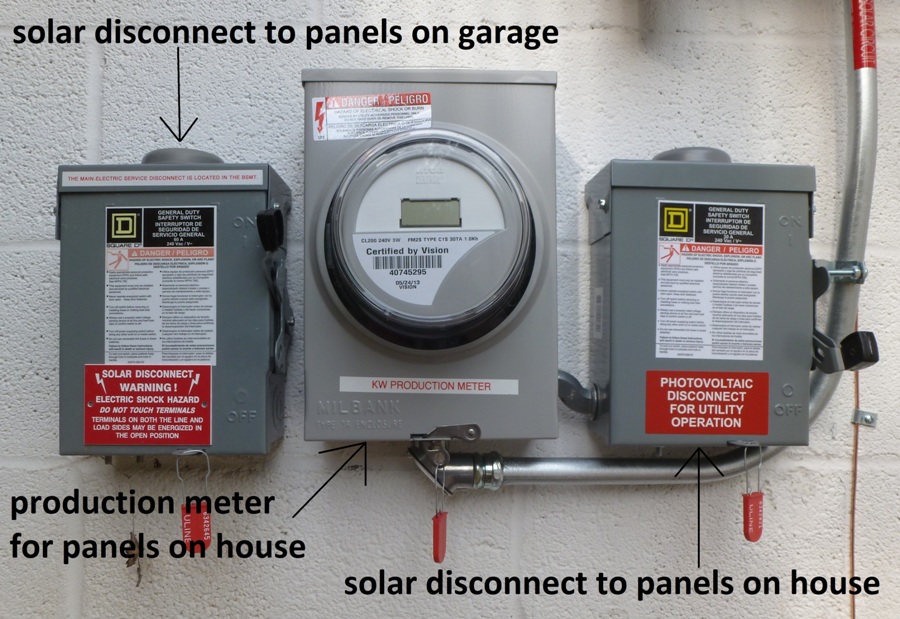
    Inside the house, an electrical conduit was run from the panels to my attic.
    Electrical conduit in attic connecting to the panels

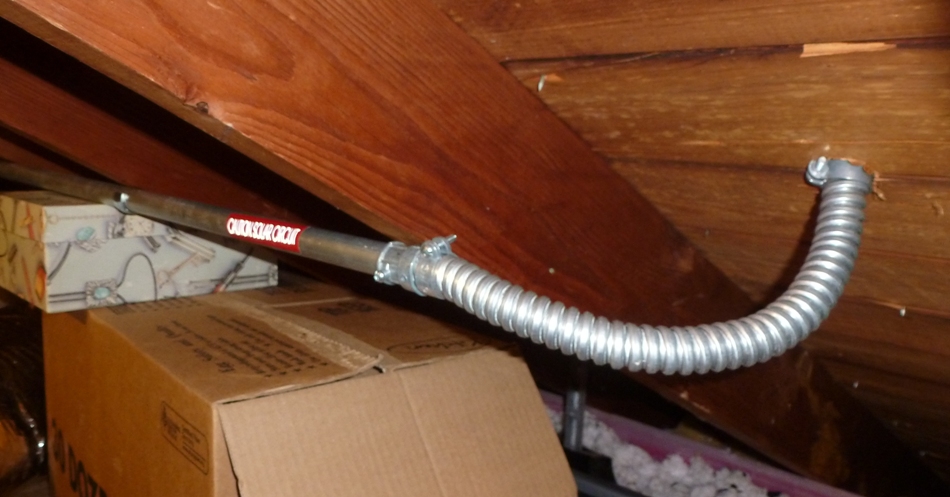
    The conduit then ran across the attic before turning to the basement.
    Electrical conduit in attic before it heads to the basement

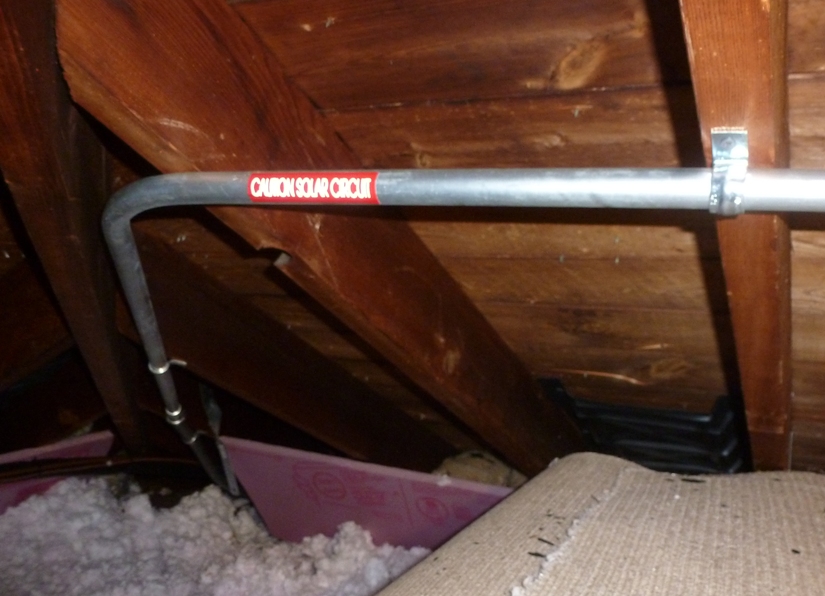
    In the basement, the wires in the conduit connected to my breaker panel. Next to the breaker panel was the solar monitoring box which contains hardware for measuring data output.
    Open solar monitoring box

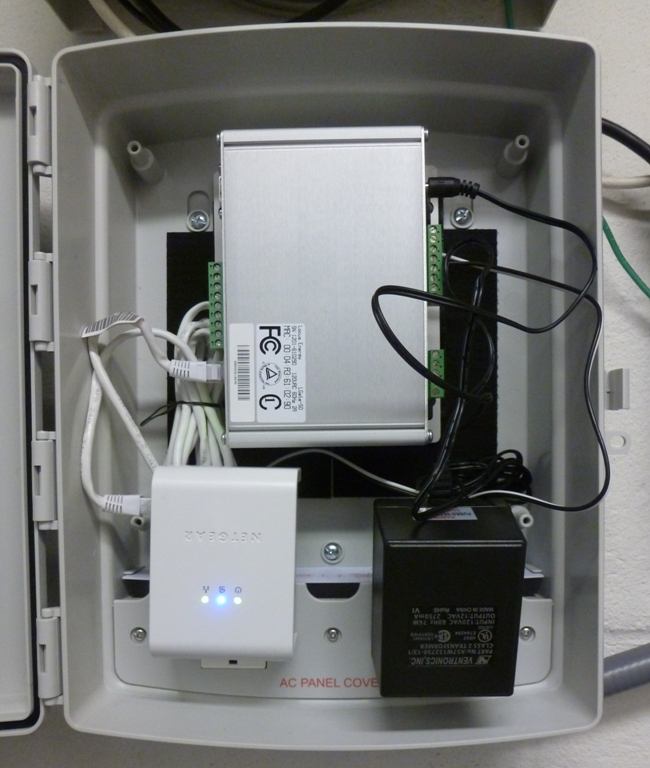
    This data is sent to my modem via a Netgear 85 Mbps wall-plugged ethernet adapter, model XET1001 outlet gateway device, and then sent to a web page where I could then monitor production. This was installed in 2013 to replace a SunPower wireless display SPR-PMR-WDISP, part number 109874 which proved unreliable.

    Netgear outlet gateway

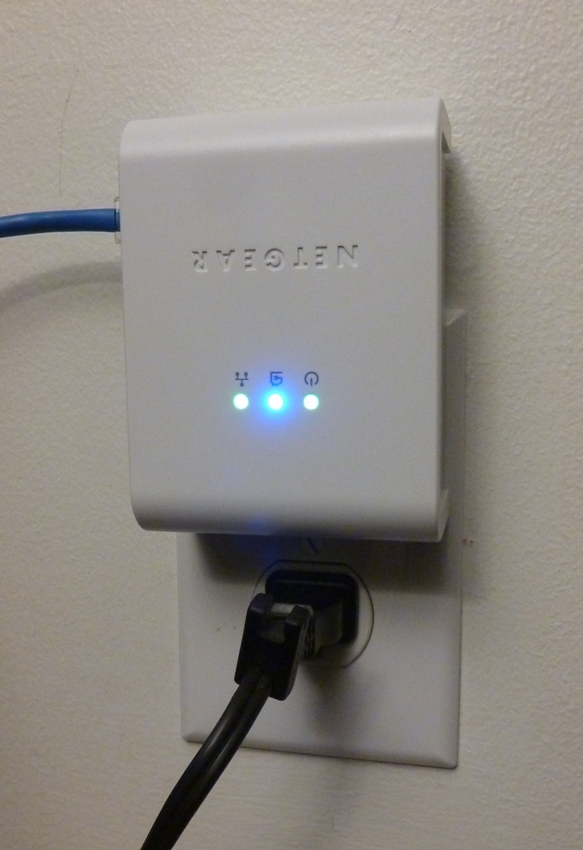
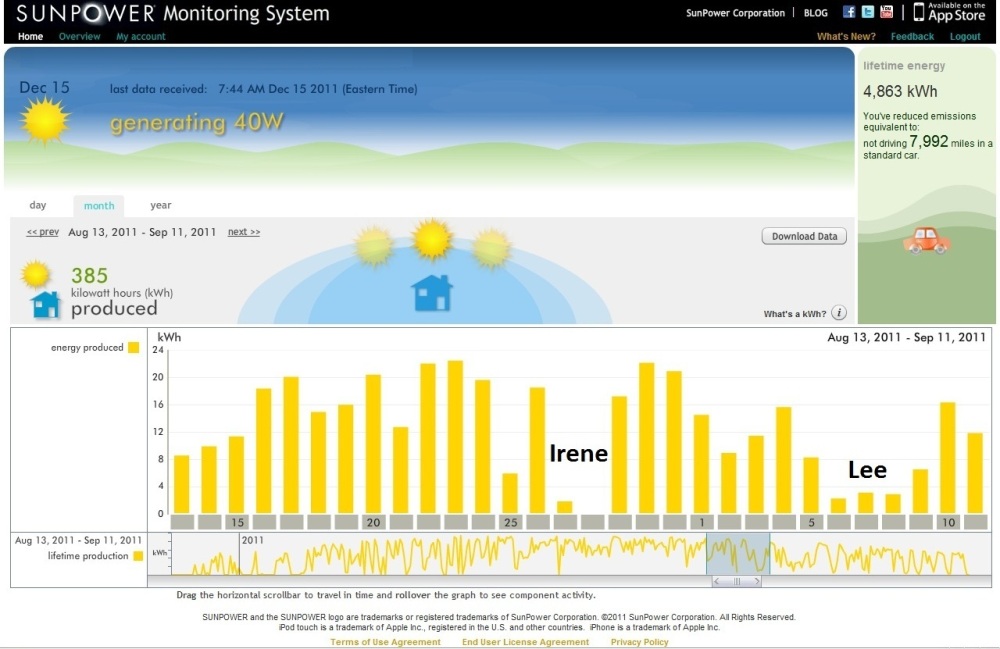
    On August 8, 2013, Keith Roycroft of Solar Energy World came by to meet the county inspectors and turn on my system. So as of August 8, 2013 the solar photovoltaic panels on my house are operational.

    I was set up with a web page where I could view the amount of energy my system generated. According to the screenshot below, my 2.65 kW Suniva system produced 15.52 kWh of electricity as of the close of August 9, 2013. Just for that day, it produced 7.66 kWh. This compares with 13.3 kWh produced on the same day by my SunPower system on the garage. I have 16 panels on the garage that comprise a 3.68 kW system. All things being equal, I would expect 13.3 x (2.65/3.68) = 9.57 kWh of electricity. But of course, all things are not equal. The panels on the house face west and do not get nearly as much sunlight as the panels on the garage. As I mentioned earlier, the garage panels have 100% solar access or near that. Panels on the house have 89% access. So I should be getting 9.57 x 0.89 = 8.52 kWh of electricity. The difference, 8.52 - 7.66 = 0.86 kWh, is about 0.86/8.52 = 10% less than the expected amount. My new Suniva panels should generate (2.65/3.68) x 0.89 = 64% of the amount of electricity as the older SunPower panels on my garage.
    Web page showing the amount of energy my system generated

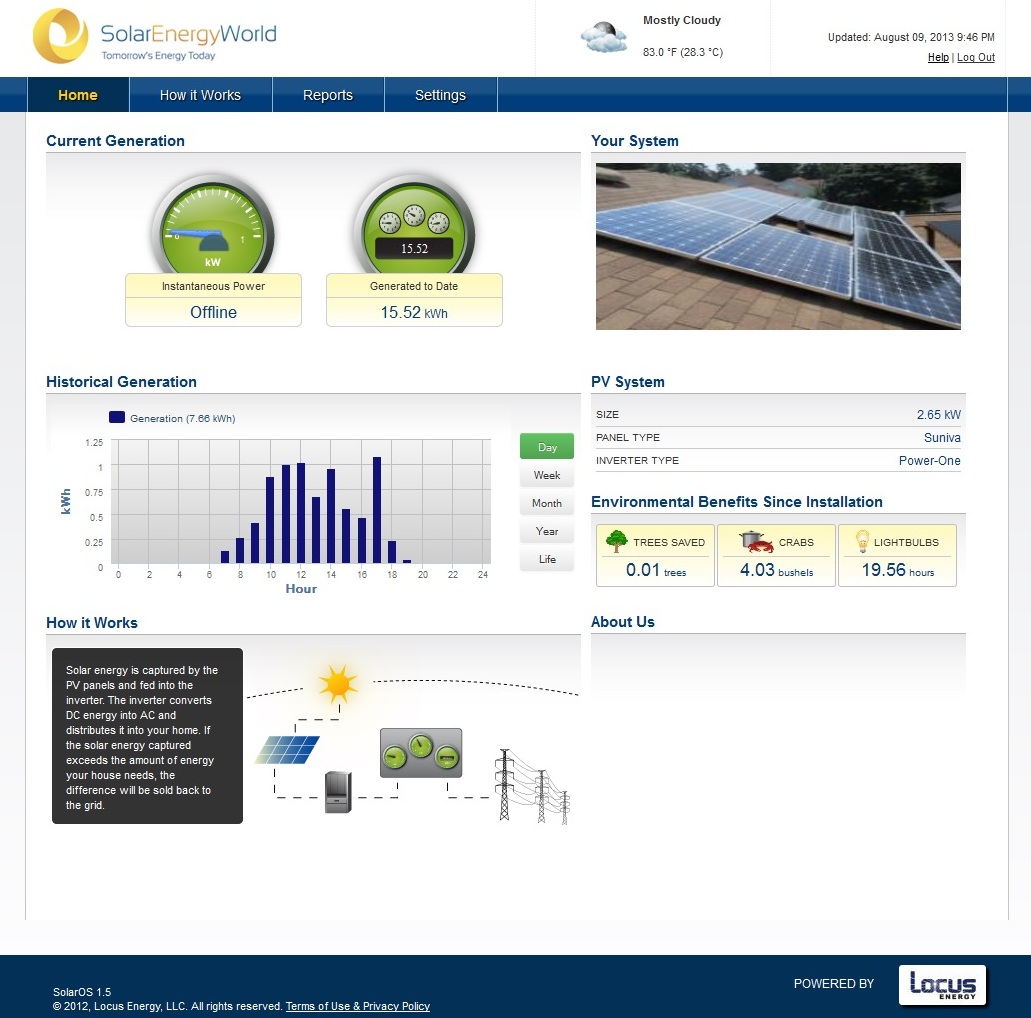
    On August 13, 2013, I filled out and submitted forms so my SRECs from the new system will be managed by Sol Systems.

    I observed over a few days that my Suniva panels' energy gathering drops off sharply around 1800. I'm guessing that is when the sun drops behind the trees on the west side of my house.

    Over 13 days from August 10 to August 23, 2013, my new Suniva panels generated 131.59 kWh, averaging 10.12 kWh per day. In comparison, my older SunPower panels generated 210 kWh over this same period. This means my Suniva panels produced 131.59/210 = 62.66% as much genergy as the SunPower panels. This is easily within ballpark range of my expectation, which is 64%.
    Close accordion icon

    Second Energy Grant deniedOpen accordion icon
    On August 29, 2013, I received word from the Maryland Energy Administration that my application for the $1000 energy grant was denied because I already have photovoltaic panels that I received grant money for two years ago.
    ...although the systems are on separate buildings and use different inverters, they still both deliver electricity to your home, is that correct? If so, this would count as serving the same load, and would therefore not be eligible for another grant. If this second system serves an entirely different load, however, then it may still be eligible.

    I wasn't upset about the state denying my grant application. I didn't think it was eligible in the first place. What annoyed me is that Solar Energy World thought I could get the money, knowing that I received it in 2011. In fact, they built it into their return on investment calculation. Had I known this, I don't know if I would have gone ahead with the purchase. I was later informed by Brent that as of 2013, the Maryland Energy Administration policy regarding the solar energy grant changed and his company was not fully informed of this change by the state. I have never known Brent to be dishonest. In fact, there are two times I can think of when he turned down the opportunity to make more money off me because he felt it was in my best interest. So I give him and his company the benefit of doubt.
    Close accordion icon


     Generating electricity

    Gaussian curveOpen accordion icon
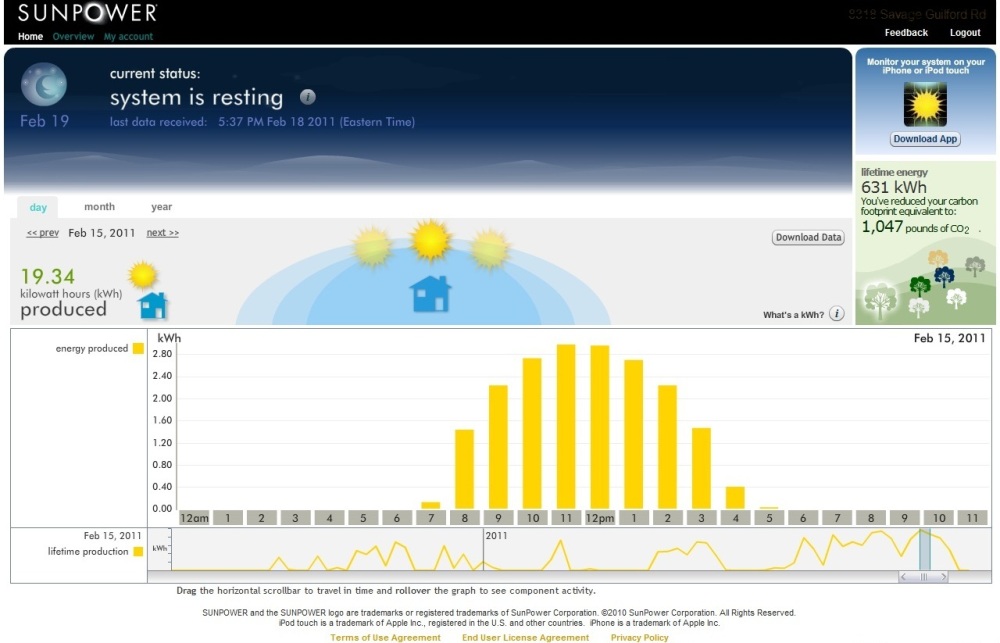
    Notice the nice Gaussian curve? This is the histogram on my SunPower account monitoring page for solar energy generation on February 15, 2011. While the amount of sunlight will vary throughout the year, days without variable cloud cover should yield a histogram with this "bell curve" shape.
    SunPower electric generation histogram for February 15, 2011
    Close accordion icon

    Surplus electricityOpen accordion icon
    One question I get is what happens if I generate more electricity than I consume? Now that I have 26 panels, this is a common scenario.
    If the energy generated by the customer-generator exceeds the energy supplied by the utility during the month, the customer-generator shall be required to pay only the customer charges for that billing month, as required by the Rate Schedule under which the customer-generator is receiving service. The utility will carry forward a negative kilowatt-hour reading for a period not to exceed 12 months and that ends annually with the April bill. The utility will pay each eligible customer-generator for the dollar value of any accrued net excess generation remaining at the end of the previous 12 month period ending with the billing cycle that is complete immediately prior to the end of April.
    - from BGE - Common Questions and forwarded to me by Andre M. Unfortunately, this website no longer exists.

    As of 2015, I have not been able to carry forward a negative kilowatt-hour reading in April but my co-worker, Rod A. has. He was reimbursed 11.29 cents per kilowatt-hour. It wasn't as much as he pays for kilowatt-hour but it isn't significantly less either. I was told that it doesn't make sense, financially, to purchase more solar panels than you need, even if you can make some money off the electric company.
    Close accordion icon

    Monthly trackingOpen accordion icon

    2010 - Gathering a baselineOpen accordion icon
    First, we need to have something to compare to. So here's our electricity usage going back to when we first bought the house on December 18, 2009, about a year prior to installing solar panels. This gives us a baseline.

  • December 19, 2009 to January 14, 2010: 685 kWh
  • January 14, 2010 to February 12, 2010: 619 kWh
  • February 12, 2010 to March 15, 2010: 1,024 kWh
  • March 15, 2010 to April 15, 2010: 662 kWh
  • April 15, 2010 to May 14, 2010: 654 kWh
  • May 14, 2010 to June 15, 2010: 726 kWh
  • June 15, 2010 to July 15, 2010: 924 kWh
  • July 15, 2010 to August 16, 2010: 1,115 kWh
  • August 16, 2010 to September 15, 2010: 759 kWh
  • September 15, 2010 to October 14, 2010: 548 kWh
  • October 14, 2010 to November 13, 2010: 613 kWh
  • November 13, 2010 to December 13, 2010: 648 kWh
    On December 7, 2010, 6 kWh were generated. The system was turned on right after passing inspection, around noon.
    On December 8, 2010, 12 kWh were generated. It was sunny.
    On December 9, 2010, 14 kWh were generated. It was sunny. Energy production started at around 0730 with about 40 watts.
    On December 10, 2010, only 2 kWh were generated. It was very overcast.
    On December 11, 2010, 7 kWH were generated. This is the first day that the SunPower account monitoring page actually started recording my electricity generation.
  • Close accordion icon

    My 16 SunPower 230 watt photovoltaic solar panels installed on December 7, 2010 should produce up to 3.68 kilowatts and an estimated 4,774 kilowatt hours (kWh) per year. This means they should produce an average of 13.08 kWh per day.

    2011Open accordion icon
  • December 13, 2010 to January 14, 2011: billed for 407 kWh; 255 was generated by solar; total consumption = 662 kWh
    On December 21, the winter solstice, 11.6 kilowatt hours were generated.
  • January 14, 2011 to February 14, 2011: billed for 396 kWh; 257 kWh was generated by solar; total consumption = 653 kWh
    My panels were averaging 8.29 kWh per day during this billing period. Not terribly great, but for almost a full week in late January there was snow on the roof so no energy was generated.
  • February 14, 2011 to March 14, 2011: billed for 252 kWh; 363 kWh generated by solar; total consumption = 615 kWh
    In February 2011, my panels averaged 11.39 kWh per day, ending with a cumulative total of 730 kWh.
  • March 14, 2011 to April 14, 2011: billed for 229 kWh; 452 kWh generated by solar; total consumption = 681 kWh
    In March 2011, my panels averaged 14.42 kWh per day, ending with a cumulative total of 1,177 kWh.
  • April 14, 2011 to May 13, 2011: billed for 21 kWh; 479 kWh generated by solar (95.8%); total consumption = 500 kWh
    Keep in mind that we were in Germany May 7-16, 2011 so our electric consumption was low.
    In April 2011, my panels averaged 14.53 kWh per day, ending with a cumulative total of 1,613 kWh.
  • May 13, 2011 to June 16, 2011: billed for 116 kWh; 599 kWh generated by solar (84%); total consumption = 715 kWh
    In May 2011, my panels averaged 16.87 kWh per day, ending with a cumulative total of 2,136 kWh.
  • June 16, 2011 to July 16, 2011: billed for 154 kWh; 560 kWh generated by solar (78%); total consumption = 714 kWh
    In June 2011, my panels averaged 18.23 kWh per day, ending with a cumulative total of 2,683 kWh.
  • July 16, 2011 to August 12, 2011: billed for 213 kWh; 720 generated by solar (77%); total consumption = 933 kWh
    In July 2011, my panels averaged 18.65 kWh per day, ending with a cumulative total of 3,281 kWh.
  • August 12, 2011 to September 15, 2011: billed for 300 kWh; 761 generated by solar (61%); total consumption = 761 kWh
    In August 2011, my panels averaged 15.45 kWh per day, ending with a cumulative total of 3,760 kWh.
    In late August, we were faced with tropical storm Irene which brought intense wind and rain. A few weeks later, tropical storm Lee brought record-breaking rains. Check out the below image to see how this affected solar energy generation.
  • SunPower Monitoring System report showing electric generation before, during, and after tropical storms

  • September 15, 2011 to October 15, 2011: billed for 310 kWh; 438 kWh generated by solar (59%); total consumption = 748 kWh
    In September 2011, my panels averaged 9.73 kWh per day, ending with a cumulative total of 4,073 kWh.
  • October 15, 2011 to November 12, 2011: billed for 149 kWh; 335 kWh generated by solar (69%); total consumption = 484 kWh
    In October 2011, my panels averaged 11.38 kWh per day, ending with a cumulative total of 4,426 kWh.
  • November 12 to December 12, 2011: billed for 248 kWh; 258 kWh generated by solar (51%); total consumption = 506 kWh
  • December 12, 2011 to January 14, 2012: billed for 290 kWh; 247 kWh generated by solar (46%); total consumption = 537 kWh
  • Close accordion icon

    2012Open accordion icon
  • January 14, 2012 to March 14, 2012: billed for 413 kWh; 788 kWh generated by solar (66%); total consumption = 1,201 kWh
  • March 14, 2012 to April 13, 2012: billed for 169 kWh; 466 kWh generated by solar (73%); total consumption = 635 kWh
  • April 13, 2012 to May 15, 2012: billed for 107 kWh; 503 kWh generated by solar (82%); total consumption = 610 kWh
  • May 15, 2012 to June 14, 2012: billed for 104 kWh; 551 kWh generated by solar (84%); total consumption = 655 kWh
  • June 14, 2012 to July 14, 2012: billed for 205 kWh; 544 kWh generated by solar (73%); total consumption = 749 kWh
  • July 14, 2012 to August 16, 2012: billed for 428 kWh; 531 kWh generated by solar (55%); total consumption = 959 kWh
    It was really hot!
  • August 16, 2012 to September 15, 2012: billed for 177 kWh; 483 kWh generated by solar (73%); total consumption = 660 kWh
  • September 15, 2012 to October 15, 2012: billed for 233 kWh; 409 kWh generated by solar (64%); total consumption = 642 kWh
  • October 15, 2012 to November 13, 2012: billed for 278 kWh; 294 kWh generated by solar (51%); total consumption = 572 kWh
  • November 13, 2012 to December 12, 2012: billed for 476 kWh; 263 kWh generated by solar (35%); total consumption = 741 kWh
    On November 15, 2012, a geothermal heat pump was turned on in my house. This means that instead of oil providing a majority of the heating, a high efficiency electric system was used. This explains the significant increase in electricity use in the November 13, 2012 to December 12, 2012 time period and thereafter during the winter. For more information, see Geothermal Energy.
  • December 12, 2012 to January 14, 2013: billed for 648 kWh; 238 kWh generated by solar (27%); total consumption = 886 kWh
  • Close accordion icon

    My 10 Suniva 260 watt photovoltaic solar panels installed on August 8, 2013 should produce up to 2.65 kilowatts and an estimated 3,131 kilowatt hours (kWh) per year. This means they should produce an average of 8.58 kWh per day.

    2013Open accordion icon
  • January 14, 2013 to February 13, 2013: billed for 635 kWh; 245 kWh generated by solar (28%); total consumption = 880 kWh
  • In March 2013, I canceled my SREC Trade account and switched to Sol Systems at the suggestion of a neighbor. Basically, SolSystems handles my SRECs and sells them when they think they can get a good price. In turn, they get a commission of the profit.
  • February 13, 2013 to March 14, 2013: billed for 603 kWh; 362 kWh generated by solar (38%); total consumption = 965 kWh
  • March 14, 2013 to April 12, 2013: billed for 273 kWh; 456 kWh generated by solar (63%); total consumption = 729 kWh
  • April 12, 2013 to May 14, 2013: billed for 253 kWh; 539 kWh generated by solar (74%); total consumption = 729 kWh
    For our 2013 Howard County property tax statement, $2801.68 was deducted from our payment for "Energy Device Credit" (solar panels). We still had to make a payment but this was for ad valorem charge, fire tax, state property tax, and trash fee.
  • May 14, 2013 to June 13, 2013: billed for 325 kWh; 475 kWh generated by solar (59%); total consumption = 800 kWh
    As compared with last year, we used an average of 7.36 kWh more electricity per day. There are a couple reasons I can think of that might help explain this. We started using the geothermal heat pump in cooling mode this late spring and summer. It isn't supposed to use much electricity in the low setting, but we had it set to the auto setting, which I then changed to low on July 15, 2013. Also, from May 30 to June 7, the Network Interface Module (NIM) on the heat pump was not working due to an electrical surge. So things ran in the inefficient mode until the NIM could be replaced.
    On May 28, 2013, I received $1,094.54 from SolSystems for selling ten SRECs. Four were sold for $95 each while six were sold for $119.59 each. This seems very low but I've been told that the prices have been coming down. I should have sold last year.
  • June 13, 2013 to July 15, 2013: billed for 281 kWh; 467 kWh generated by solar (62%); total consumption = 748 kWh
    Our summer has been very rainy.
  • July 15, 2013 to August 15, 2013: billed for 15 kWh; 602 kWh generated by solar (98%); total consumption = 617 kWh. 87 kwh were generated by the Suniva panels on the house (which went operational on August 8) while 602 kwh were generated by the SunPower panels on the garage.
  • August 15, 2013 to November 13, 2013: billed for 0 kWh. My statement showed "accrued carryover kWh" of -500 meaning that at one point, we had 500 kWh surplus.
    On August 29, 2013, I received $252.96 from SolSystems for the sale of two SRECs.
    In November 2013, I sold one SREC for $128.
  • November 13 to December 13, 2013: billed for 0 kWh
    On the evening of December 11, our surplus of electricity as recorded by the new net meter installed on August 16 ran out. In other words, when it was first installed, the net meter read zero. Then it ran backwards because we generated more electricity than we consumed. At one point it said we had 500 kwh surplus. But as the days got shorter, we used up this surplus. As of December 11, we are back to zero.
    My BGE statement showed "accrued carryover kWh" of -2 meaning that as of December 13, we were down to our last 2 kwh of surplus. In actuality, we were no longer in surplus mode since we used up all our surplus as of December 11.
  • December 13, 2013 to January 15, 2014: billed for 580 kWh; 312 kWh generated by solar (35%); total consumption = 893 kWh. 129 kWh were generated by the panels on the house while 183 kWh were generated by the panels on the garage. It is a shame that it took so long to accummulate 500 kWh of surplus energy and only about 3.5 weeks to use that same amount.
  • Close accordion icon

    2014Open accordion icon
  • January 15, 2014 to February 13, 2014: billed for 543 kWh; 324 kWh generated by solar (37%); total consumption = 867 kWh. 132 kWh were generated by the panels on the house while 192 kWh were generated by the panels on the garage.
  • February 13, 2014 to March 13, 2014: billed for 430 kWh; 499 kWh generated by solar (54%); total consumption = 929 kWh. 292 kWh were generated by the panels on the house while 207 kWh were generated by the panels on the garage.
    In March 2014, I received $137.95 from SolSystems for selling one SREC.
  • March 13, 2014 to April 14, 2014: billed for 129 kWh; 676 kWh generated by solar (84%); total consumption = 805 kWh. 263 kWh were generated by the panels on the house while 413 kWh were generated by the panels on the garage.
    Sometime around spring equinox seems to be about when the net meter noticeably started running backwards over the course of 24 hours, assuming the sun was out.
  • April 14, 2014 to May 14, 2014: billed for 0 kWh; 827 kWh generated by solar (100%); 327 kWh were generated by the panels on the house while 500 kWh were generated by the panels on the garage.
  • May 14, 2014 to June 13, 2014: billed for 0 kWh; 852 kWh generated by solar (100%); 331 kWh were generated by the panels on the house while 521 kWh were generated by the panels on the garage.
    On May 29, 2014, I received $254.76 for selling two SRECs.
    For our 2014 Howard County property tax statement, $2,198.32 was deducted from our payment for "Energy Device Credit" (solar panels).
  • June 13, 2014 to July 15, 2014: billed for 0 kWh; 808 kWh generated by solar (100%); 378 kWh were generated by the panels on the house while 430 kWh were generated by the panels on the garage.
  • July 15, 2014 to August 14, 2014: billed for 0 kWh; 794 kWh generated by solar (100%); 322 kWh were generated by the panels on the house while 472 kWh were generated by the panels on the garage.
    Normally, the panels on the house generate about 65% as much electricity as panels on the garage but the panels on the garage did not report any electricity on August 13-14 while only a minimal amount of electric generation was reported for August 12. Over these days, it should have reported about 38 kwh. This is 38 kwh that could have been used for SREC reporting. Estimated total electric consumption was about 617 kwh based on 2013 estimates.
  • August 14, 2014 to September 15, 2014: billed for 0 kWh; 742 kWh generated by solar (100%); 307 kWh were generated by the panels on the house while 435 kWh were generated by the panels on the garage.
    The garage on the garage did not report any electricity on August 14-17. Over these days, it should have reported about 71 kwh which could have been used for SREC reporting. Estimated total electric consumption was about 660 kwh based on 2012 estimates (2013 estimate for this time period not available).
    On August 29, 2014, I received $239.68 for selling two SRECs.
  • September 15, 2014 to October 15, 2014: billed for 0 kWh; 566 kWh generated by solar (100%); 222 kWh were generated by the panels on the house while 344 kWh were generated by the panels on the garage.
    The panels on the garage did not report any electricity on September 25-26. Over these days, it should have reported about 21 kwh which could have been used for SREC reporting. Estimated total electric consumption was about 642 kwh based on 2012 estimates (2013 estimate for this time period not available).
    I think we reached our net meter low point for the year. It showed 628 kwh on October 10, 2014. This was just a few days after the fall equinox.
  • October 15, 2014 to November 13, 2014: billed for 0 kWh; 466 kWh generated by solar (69%); 186 kWh were generated by the panels on the house while 280 kWh were generated by the panels on the garage.
    The panels on the garage did not report any electricity on most of November 9, all of October 27, and most of October 28. Over these days, it should have reported about 32 kwh which could have been used for SREC reporting. Total electric consumption was 674 kWh.
    On November 9, 2014, my SunPower panels stopped registering energy generation sometime after 1000 for the rest of the day. I know there was plenty of sun because my Suniva panels were generating plenty of electricity (6.55 kwh) and the SunPower website reported only 5 kwh for the day and displayed an error message.
  • On November 21, 2014, I received an e-mail from Victoria at SolSystems informing me that they made a change to my account so that my two photovoltaic systems are now reflected as one 6.33 kW system. She also asked me to provide my current meter production. I replied with information posted by the provider websites, the inverters, and the Suniva meter. My SunPower system does not have its own production meter. Here is the important information, accurate as of November 23, 2014 at 1415:
         Suniva Inverter: 3850 kwh
         SunPower Inverter: 19,268 kWh
    I asked Victoria if the two photovoltaic systems could be kept separate so I could track the performance of each. She said
    It is currently not possible to keep the two systems separate because they are treated as one system by the state and regulatory bodies. Going forward, we will not be able to access your readings remotely because your have two separate remote monitoring systems. But rather, you will need to log into your system pages and enter your total system readings (including your expansion) on a monthly basis. We will send you a reminder email on the 27th and 5th of each month to enter your readings. Please let us know if you have any additional questions.
  • November 13, 2014 to December 12, 2014: billed for 0 kWh; 335 kWh generated by solar (38%); 120 kWh were generated by the panels on the house while 215 kWh were generated by the panels on the garage. Total electric consumption was 887 kWh. On December 7, 2014, I reported the following to SolSystems:
         Suniva Inverter: 3890 kWh
         SunPower Inverter: 19,336 kWh
         Total: 23,226 kWh
  • I've never been much into decorating my home with Christmas lights but Norma enjoys it. We have our pine tree and front roof gutters decorated with at least some LED and possibly some non-LED lights. I would describe it as a modest display. These are controled by an outdoor timer/splitter. I measured electric consumption over six days from Christmas to New Years Eve. It averaged 1.28 kWh per day, roughly equivalent to 15.6 cents per day.
  • Close accordion icon

    2015Open accordion icon
  • December 12, 2014 to January 14, 2015: billed for 569 kWh; 334 kWh generated by solar (37%); 120 kWh were generated by the panels on the house while 214 kWh were generated by the panels on the garage. Total electric consumption was 903 kWh. On January 16, 2015, I reported the following to SolSystems:
         Suniva Inverter: 3,993 kWh
         SunPower Inverter: 19,501 kWh
         Total: 23,494 kWh
  • January 14, 2015 to February 13, 2015: billed for 611 kWh; 400 kWh generated by solar (65%); 151 kWh were generated by the panels on the house while 249 kWh were generated by the panels on the garage. Total electric consumption was 1,011 kWh. On February 16, 2015, I reported the following to SolSystems:
         Suniva Inverter: 4,134 kWh
         SunPower Inverter: 19,725 kWh
         Total: 23,859 kWh
  • February 13, 2015 to March 13, 2015: billed for 778 kWh; 278 kWh generated by solar (26%); 151 kWh were generated by the panels on the house while 127 kWh were generated by the panels on the garage. This is due to a large amount snow and the fact that the garage roof is not as steep as the house roof. Total electric consumption was 1,056 kWh.
    On March 2, 2015, I received $308.44 from SolSystems for the sale of two SRECs.
    On March 21, 2015, I reported the following to SolSystems:
         Suniva Inverter: 4,333 kWh
         SunPower Inverter: 19,916 kWh
         Total: 24,249 kWh
  • March 13, 2015 to April 14, 2015: billed for 70 kWh; 757 kWh generated by solar (92%); 296 kWh were generated by the panels on the house while 461 kWh were generated by the panels on the garage. Total electric consumption was 827 kWh. On April 21, 2015, I reported the following to SolSystems:
         Suniva Inverter: 4,632 kWh
         SunPower Inverter: 20,383 kWh
         Total: 25,015 kWh
  • On May 13, 2015, I reported the following to SolSystems. Their website seemed to think I generated too much electricity so it requested I submit a photo. This is an annoyance that still continues to this day, as of 2024. Since I have two systems, I had to paste both images into one.
         Suniva Inverter: 4,880 kWh
         SunPower Inverter: 20,785 kWh
         Total: 25,665 kWh
  • April 14, 2015 to May 13, 2015: billed for 0 kWh; 845 kWh generated by solar (100%); 319 kWh were generated by the panels on the house while 526 kWh were generated by the panels on the garage. Total electric consumption was 577 kWh. On May 13, 2015, I reported the following to SolSystems:
         Suniva Inverter: 4,880 kWh
         SunPower Inverter: 20,785 kWh
         Total: 25,665 kWh
  • May 13, 2015 to June 15, 2015: billed for 0 kWh; 946 kWh generated by solar (100%); 367 kWh were generated by the panels on the house while 579 kWh were generated by the panels on the garage. Total electric consumption was 715 kWh. On May 29, 2015, I reported the following to SolSystems:
         Suniva Inverter: 5,065 kWh
         SunPower Inverter: 21,073 kWh
         Total: 26,138 kWh
  • June 15, 2015 to July 15, 2015: billed for 0 kWh; 787 kWh generated by solar (100%); 306 kWh were generated by the panels on the house while 481 kWh were generated by the panels on the garage. Total electric consumption was 767 kWh. On June 24, 2015, I reported the following to SolSystems:
         Suniva Inverter: 5,332 kWh
         SunPower Inverter: 21,484 kWh
         Total: 26,816 kWh
  • July 15, 2015 to August 14, 2015: billed for 0 kWh; 858 kWh generated by solar (100%); 531 kWh were generated by the panels on the house while 327 kWh were generated by the panels on the garage. Total electric consumption was 758 kWh. On July 22, 2015, I reported the following to SolSystems:
         Suniva Inverter: 5,624 kWh
         SunPower Inverter: 21,934 kWh
         Total: 27,558 kWh
  • August 14, 2015 to September 15, 2015: billed for 0 kWh. Approximately 887 kWh generated by solar (100%); about 558 kWh were generated by the panels on the garage while 329 kWh were generated by the panels on the house. Total electric consumption was 803 kWh. Why do I say "approximately"? See Troubleshooting.
    On August 29, 2015, I reported the following to SolSystems:
         Suniva Inverter: 6,014 kWh
         SunPower Inverter: 22,576 kWh
         Total: 28,590 kWh
    On September 4, 2015, I received $497.07 from SolSystems for the sale of three SRECs at $165.69 each.
  • September 15, 2015 to October 14, 2015: billed for 0 kWh. Approximately 585 kWh generated by solar (98%); about 368 kWh were generated by the panels on the garage while 217 kWh were generated by the panels on the house. Total electric consumption was 596 kWh. On September 20, 2015, I reported the following to SolSystems:
         Suniva Inverter: 6,233 kWh
         SunPower Inverter: 22,948 kWh
         Total: 29,181 kWh
  • October 14, 2015 to November 12, 2015: billed for 0 kWh; Approximately 490 kWh generated by solar (72%); about 310 kWh were generated by the panels on the garage while 180 kWh were generated by the panels on the house. Total electric consumption was 677 kWh. On November 3, 2015, I reported the following to SolSystems:
         Suniva Inverter: 6,528 kWh
         SunPower Inverter: 23,447 kWh
         Total: 29,975 kWh
  • November 12, 2015 to December 12, 2015: billed for 0 kWh; 433 kWh generated by solar (59%); 278 kWh were generated by the panels on the garage while 155 kWh were generated by the panels on the house. Total electric consumption was 737 kWh. On November 26, 2015, I reported the following to SolSystems:
         Suniva Inverter: 6,653 kWh
         SunPower Inverter: 23,664 kWh
         Total: 30,317 kWh
  • December 12, 2015 to January 14, 2016: billed for 558 kWh; 343 kWh generated by solar (38%); 217 kWh were generated by the panels on the garage while 126 kWh were generated by the panels on the house. Total electric consumption was 901 kWh.
    On December 13, 2015, I received $316.78 from SolSystems for the sale of two SRECs at $158.39 each.
    On December 28, 2015, I reported the following to SolSystems:
         Suniva Inverter: 6,762 kWh
         SunPower Inverter: 23,853 kWh
         Total: 30,615 kWh
  • Close accordion icon

    2016Open accordion icon
  • January 14, 2016 to February 12, 2016: billed for 621 kWh; 325 kWh generated by solar (34%); 188 kWh were generated by the panels on the garage while 137 kWh were generated by the panels on the house. Total electric consumption was 946 kWh. On January 18, 2016, I reported the following to SolSystems:
         Suniva Inverter: 6,856 kWh
         SunPower Inverter: 24,022 kWh
         Total: 30,878 kWh
  • February 12, 2016 to March 14, 2016: billed for 237 kWh; 569 kWh generated by solar (71%); 353 kWh were generated by the panels on the garage while 216 kWh were generated by the panels on the house. Total electric consumption was 806 kWh.
    On February 15, 2016, I reported the following to SolSystems.
         Suniva Inverter: 6,994 kWh
         SunPower Inverter: 24,203 kWh
         Total: 31,197 kWh
    On March 10, 2016, I received $372.66 from SolSystems for the sale of three SRECs at $124.22 each.
  • March 14, 2016 to April 14, 2016: billed for 0 kWh; 815 kWh generated by solar (100%); 502 kWh were generated by the panels on the garage while 313 kWh were generated by the panels on the house. Total electric consumption was 713 kWh. On March 27, 2016, I reported the following to SolSystems:
         Suniva Inverter: 7,301 kWh
         SunPower Inverter: 24,694 kWh
         Total: 31,995 kWh
  • April 14, 2016 to May 13, 2016: billed for 0 kWh; 630 kWh generated by solar (100%, we had many cloudy days); 388 kWh were generated by the panels on the garage while 242 kWh were generated by the panels on the house. Total electric consumption was 529 kWh (we were on vacation for about ten days). On April 20, 2016, I reported the following to SolSystems:
         Suniva Inverter: 7,583 kWh
         SunPower Inverter: 25,142 kWh
         Total: 32,725 kWh
  • May 13, 2016 to June 15, 2016: billed for 0 kWh; 912 kWh generated by solar (100%); 554 kWh were generated by the panels on the garage while 358 kWh were generated by the panels on the house. Total electric consumption was 696 kWh.
    On May 17, 2016, I reported the following to SolSystems:
         Suniva Inverter: 7,772 kWh
         SunPower Inverter: 25,430 kWh
         Total: 32,202 kWh
    On May 31, 2016, I received $67.78 for selling two SRECs to SolSystems at $33.89 each. The SREC value dropped significantly.
  • June 15, 2016 to July 14, 2016: billed for 0 kWh; 826 kWh generated by solar (100%); 505 kWh were generated by the panels on the garage while 321 kWh were generated by the panels on the house. Total electric consumption was 627 kWh. On June 27, 2016, I reported the following to SolSystems:
         Suniva Inverter: 8,216 kWh
         SunPower Inverter: 26,104 kWh
         Total: 34,320 kWh
  • July 14, 2016 to August 15, 2016: billed for 0 kWh; 896 kWh generated by solar (100%); 558 kWh were generated by the panels on the garage while 338 kWh were generated by the panels on the house. Total electric consumption was 796 kWh. On August 8, 2016, I reported the following to SolSystems:
         Suniva Inverter: 8,668 kWh
         SunPower Inverter: 26,820 kWh
         Total: 35,488 kWh
  • August 15, 2016 to September 15, 2016: billed for 0 kWh; 875 kWh generated by solar (100%); 555 kWh were generated by the panels on the garage while 320 kWh were generated by the panels on the house. Total electric consumption was 745 kWh. On September 2, 2016, I reported the following to SolSystems:
         Suniva Inverter: 8,913 kWh
         SunPower Inverter: 27,245 kWh
         Total: 36,158 kWh
  • September 15, 2016 to October 14, 2016: billed for 0 kWh; 527 kWh generated by solar (100%); 326 kWh were generated by the panels on the garage while 201 kWh were generated by the panels on the house. Total electric consumption was 533 kWh. On October 1, 2016, I reported the following to SolSystems:
         Suniva Inverter: 9,141 kWh
         SunPower Inverter: 27,620 kWh
         Total: 36,761 kWh
  • October 14, 2016 to November 14, 2016: billed for 0 kWh; 638 kWh generated by solar (100%); 405 kWh were generated by the panels on the garage while 233 kWh were generated by the panels on the house. Total electric consumption was 701 kWh. On October 22, 2016, I reported the following to SolSystems:
         Suniva Inverter: 9,301 kWh
         SunPower Inverter: 27,881 kWh
         Total: 37,182 kWh
  • November 14, 2016 to December 14, 2016: billed for 0 kWh; 419 kWh generated by solar; 266 kWh were generated by the panels on the garage while 153 kWh were generated by the panels on the house. Total electric consumption was 797 kWh.
    On November 20, 2016, I reported the following to SolSystems:
         Suniva Inverter: 9,500 kWh
         SunPower Inverter: 28,221 kWh
         Total: 37,721 kWh
    On November 29, 2016, I received $44.34 for selling three SRECs to SolSystems at $14.78 each.
  • December 14, 2016 to January 14, 2017: billed for 743 kWh; 334 kWh generated by solar; 212 kWh were generated by the panels on the garage while 122 kWh were generated by the panels on the house. Total electric consumption was 1,077 kWh. On December 17, 2016, I reported the following to SolSystems:
         Suniva Inverter: 9,630 kWh
         SunPower Inverter: 28,441 kWh
         Total: 38,071 kWh
  • Close accordion icon

    2017Open accordion icon
  • January 14, 2017 to February 13, 2017: billed for 571 kWh; 362 kWh generated by solar; 225 kWh were generated by the panels on the garage while 137 kWh were generated by the panels on the house. Total electric consumption was 933 kWh. On January 27, 2017, I reported the following to SolSystems:
         Suniva Inverter: 9,781 kWh
         SunPower Inverter: 28,693 kWh
         Total: 38,474 kWh
  • February 13, 2017 to March 14, 2017: billed for 33 kWh; 661 kWh generated by solar; 410 kWh were generated by the panels on the garage while 251 kWh were generated by the panels on the house. Total electric consumption was 694 kWh. On March 5, 2017, I reported the following to SolSystems:
         Suniva Inverter: 10,028 kWh
         SunPower Inverter: 29,094 kWh
         Total: 39,122 kWh
  • March 14, 2017 to April 13, 2017: billed for 67 kWh; 683 kWh generated by solar; 423 kWh were generated by the panels on the garage while 260 kWh were generated by the panels on the house. Total electric consumption was 750 kWh.
  • April 13, 2017 to May 12, 2017: billed for 0 kWh; 645 kWh generated by solar; 394 kWh were generated by the panels on the garage while 251 kWh were generated by the panels on the house. Total electric consumption was 534 kWh.
    We've had a dark spring. I've had to turn on the electric heating element on our solar hot water heater twice now because there wasn't enough sun over several days for the solar thermal panels to heat water sufficiently. I never had to do this before so early in the year. Looking at the solar photovoltaic generation, the production hasn't been this low since the January 14, 2017 to February 13, 2017 period.
    On April 23, 2017, I reported the following to SolSystems:
         Suniva Inverter: 10,462 kWh
         SunPower Inverter: 29,786 kWh
         Total: 40,248 kWh
  • May 12, 2017 to June 15, 2017: billed for 0 kWh; 863 kWh generated by solar; 525 kWh were generated by the panels on the garage while 338 kWh were generated by the panels on the house. Total electric consumption was 618 kWh. On May 27, 2017, I reported the following to SolSystems:
         Suniva Inverter: 10,753 kWh
         SunPower Inverter: 30,235 kWh
         Total: 40,988 kWh
  • June 15, 2017 to July 14, 2017: billed for 0 kWh; 805 kWh generated by solar; 492 kWh were generated by the panels on the garage while 313 kWh were generated by the panels on the house. Total electric consumption was 707 kWh. On June 30, 2017, I reported the following to SolSystems:
         Suniva Inverter: 11,116 kWh
         SunPower Inverter: 30,789 kWh
         Total: 41,905 kWh
  • July 14, 2017 to August 14, 2017: billed for 0 kWh; 771 kWh generated by solar; 482 kWh were generated by the panels on the garage while 291 kWh were generated by the panels on the house. Total electric consumption was 661 kWh. On July 21, 2017, I reported the following to SolSystems:
         Suniva Inverter: 11,333 kWh
         SunPower Inverter: 31,132 kWh
         Total: 42,465 kWh
  • August 14, 2017 to September 15, 2017: billed for 0 kWh; 728 kWh generated by solar; 460 kWh were generated by the panels on the garage while 261 kWh were generated by the panels on the house. Total electric consumption was 603 kWh. On September 1, 2017, I reported the following to SolSystems:
         Suniva Inverter: 11,708 kWh
         SunPower Inverter: 31,753 kWh
         Total: 43,461 kWh
  • September 15, 2017 to October 14, 2017: billed for 0 kWh; 592 kWh generated by solar; 376 kWh were generated by the panels on the garage while 216 kWh were generated by the panels on the house. Total electric consumption was 563 kWh. On October 1, 2017, I reported the following to SolSystems:
         Suniva Inverter: 11,951 kWh
         SunPower Inverter: 32,170 kWh
         Total: 44,121 kWh
  • October 14, 2017 to November 13, 2017: billed for 0 kWh; 532 kWh generated by solar; 333 kWh were generated by the panels on the garage while 199 kWh were generated by the panels on the house. Total electric consumption was 716 kWh. On October 20, 2017, I reported the following to SolSystems:
         Suniva Inverter: 12,068 kWh
         SunPower Inverter: 32,364 kWh
         Total: 44,432 kWh
  • November 13, 2017 to December 13, 2017: billed for 0 kWh; 442 kWh generated by solar; 284 kWh were generated by the panels on the garage while 158 kWh were generated by the panels on the house. Total electric consumption was 823 kWh. On November 20, 2017, I reported the following to SolSystems:
         Suniva Inverter: 12,254 kWh
         SunPower Inverter: 32,677 kWh
         Total: 44,432 kWh
  • December 13, 2017 to January 16, 2018: billed for 330 kWh; 420 kWh generated by solar; 261 kWh were generated by the panels on the garage while 159 kWh were generated by the panels on the house. Total electric consumption was 750 kWh. On December 19, 2017, I reported the following to SolSystems:
         Suniva Inverter: 12,396 kWh
         SunPower Inverter: 32,931 kWh
         Total: 45,327 kWh
  • Close accordion icon

    2018Open accordion icon
  • January 16, 2018 to February 13, 2018: billed for 612 kWh; 379 kWh generated by solar; 238 kWh were generated by the panels on the garage while 141 kWh were generated by the panels on the house. Total electric consumption was 991 kWh. On January 28, 2018, I reported the following to SolSystems:
         Suniva Inverter: 12,585 kWh
         SunPower Inverter: 33,239 kWh
         Total: 45,824 kWh
  • February 13, 2018 to March 14, 2018: billed for 371 kWh; 488 kWh generated by solar; 303 kWh were generated by the panels on the garage while 185 kWh were generated by the panels on the house. Total electric consumption was 859 kWh. On February 25, 2018, I reported the following to SolSystems:
         Suniva Inverter: 12,711 kWh
         SunPower Inverter: 33,439 kWh
         Total: 46,150 kWh
  • March 14, 2018 to April 13, 2018: billed for 343 kWh; 672 kWh generated by solar; 417 kWh were generated by the panels on the garage while 255 kWh were generated by the panels on the house. Total electric consumption was 1,015 kWh. On March 21, 2018, I reported the following to SolSystems:
         Suniva Inverter: 12,892 kWh
         SunPower Inverter: 33,743 kWh
         Total: 46,635 kWh
  • April 13, 2018 to May 14, 2018: billed for 0 kWh; 811 kWh generated by solar; 494 kWh were generated by the panels on the garage while 317 kWh were generated by the panels on the house. Total electric consumption was 809 kWh. On April 27, 2018, I reported the following to SolSystems:
         Suniva Inverter: 13,221 kWh
         SunPower Inverter: 34,268 kWh
         Total: 47,489 kWh
  • May 14, 2018 to June 14, 2018: billed for 50 kWh; 672 kWh generated by solar; 411 kWh were generated by the panels on the garage while 261 kWh were generated by the panels on the house. Total electric consumption was 725 kWh (3 kWh credit used). My panels produced 93% as much electricity as the previous period, even though the days were longer more recently. We had a lot of rain. On May 28, 2018, I reported the following to SolSystems:
         Suniva Inverter: 13,511 kWh
         SunPower Inverter: 34,728 kWh
         Total: 48,239 kWh
  • June 14, 2018 to July 16, 2018: billed for 0 kWh; 882 kWh generated by solar; 544 kWh were generated by the panels on the garage while 338 kWh were generated by the panels on the house. Total electric consumption was 828 kWh. On June 30, 2018, I reported the following to SolSystems:
         Suniva Inverter: 13,806 kWh
         SunPower Inverter: 35,188 kWh
         Total: 48,994 kWh
  • July 16, 2018 to August 14, 2018: billed for 40 kWh; 693 kWh generated by solar; 433 kWh were generated by the panels on the garage while 260 kWh were generated by the panels on the house. Total electric consumption was 693 kWh. We've had a very dark and rainy latter half of the summer. This is the worst solar reading I've gotten yet for the July to August time period. On July 28, 2018, I reported the following to SolSystems:
         Suniva Inverter: 14,072 kWh
         SunPower Inverter: 35,615 kWh
         Total: 49,687 kWh
  • August 14, 2018 to September 13, 2018: billed for 119 kWh; 645 kWh generated by solar; 409 kWh were generated by the panels on the garage while 236 kWh were generated by the panels on the house. Total electric consumption was 764 kWh. On August 14, 2018, I reported the following to SolSystems.
         Suniva Inverter: 14,290 kWh
         SunPower Inverter: 35,973 kWh
         Total: 50,263 kWh
  • September 13, 2018 to October 12, 2018: billed for 198 kWh; 446 kWh generated by solar; 278 kWh were generated by the panels on the garage while 168 kWh were generated by the panels on the house. Total electric consumption was 644 kWh. On September 26, 2018, I reported the following to SolSystems:
         Suniva Inverter: 14,526 kWh
         SunPower Inverter: 36,377 kWh
         Total: 50,903 kWh
  • October 12, 2018 to November 12, 2018: billed for 401 kWh; 531 kWh generated by solar; 341 kWh were generated by the panels on the garage while 190 kWh were generated by the panels on the house. Total electric consumption was 932 kWh. On October 24, 2018, I reported the following to SolSystems:
         Suniva Inverter: 14,720 kWh
         SunPower Inverter: 36,702 kWh
         Total: 51,422 kWh
  • November 12, 2018 to December 13, 2018: billed for 640 kWh; 374 kWh generated by solar; 237 kWh were generated by the panels on the garage while 137 kWh were generated by the panels on the house. Total electric consumption was 1,014 kWh. On November 20, 2018, I reported the following to SolSystems:
         Suniva Inverter: 14,849 kWh
         SunPower Inverter: 36,931 kWh
         Total: 51,780 kWh
  • December 13, 2018 to January 14, 2019: billed for 750 kWh; 308 kWh generated by solar; 196 kWh were generated by the panels on the garage while 112 kWh were generated by the panels on the house. Total electric consumption was 1,058 kWh. On December 27, 2018, I reported the following to SolSystems:
         Suniva Inverter: 15,000 kWh
         SunPower Inverter: 37,196 kWh
         Total: 52,196 kWh
  • Close accordion icon

    2019Open accordion icon
  • January 14, 2019 to February 13, 2019: billed for 664 kWh; 346 kWh generated by solar; 218 kWh were generated by the panels on the garage while 128 kWh were generated by the panels on the house. Total electric consumption was 1,010 kWh. On January 18, 2019, I reported the following to SolSystems:
         Suniva Inverter: 15,115 kWh
         SunPower Inverter: 37,383 kWh
         Total: 52,498 kWh
  • February 13, 2019 to March 14, 2019: billed for 488 kWh; 505 kWh generated by solar; 312 kWh were generated by the panels on the garage while 193 kWh were generated by the panels on the house. Total electric consumption was 993 kWh. On February 23, 2019, I reported the following to SolSystems:
         Suniva Inverter: 15,239 kWh
         SunPower Inverter: 37,594 kWh
         Total: 52,833 kWh
  • March 14, 2019 to April 12, 2019: billed for 5 kWh; 732 kWh generated by solar; 465 kWh were generated by the panels on the garage while 267 kWh were generated by the panels on the house. Total electric consumption was 737 kWh. On March 23, 2019, I reported the following to SolSystems:
         Suniva Inverter: 15,461 kWh
         SunPower Inverter: 37,954 kWh
         Total: 53,415 kWh
  • April 12, 2019 to May 13, 2019: billed for 4 kWh; 644 kWh generated by solar; 399 kWh were generated by the panels on the garage while 245 kWh were generated by the panels on the house. Total electric consumption was 648 kWh. On April 30, 2019, I reported the following to SolSystems:
         Suniva Inverter: 15,802 kWh
         SunPower Inverter: 38,529 kWh
         Total: 54,331 kWh
  • May 13, 2019 to June 14, 2019: billed for 0 kWh; 881 kWh generated by solar; 542 kWh were generated by the panels on the garage while 339 kWh were generated by the panels on the house. Total electric consumption was 672 kWh. On May 31, 2019, I reported the following to SolSystems:
         Suniva Inverter: 16,069 kWh
         SunPower Inverter: 38,959 kWh
         Total: 55,028 kWh
  • June 14, 2019 to July 16, 2019: billed for 0 kWh; 911 kWh generated by solar; 561 kWh were generated by the panels on the garage while 350 kWh were generated by the panels on the house. Total electric consumption was 730 kWh. On June 25, 2019, I reported the following to SolSystems:
         Suniva Inverter: 16,339 kWh
         SunPower Inverter: 39,373 kWh
         Total: 55,712 kWh
  • July 16, 2019 to August 14, 2019: billed for 0 kWh; 787 kWh generated by solar; 497 kWh were generated by the panels on the garage while 290 kWh were generated by the panels on the house. Total electric consumption was 706 kWh. On July 21, 2019, I reported the following to SolSystems:
         Suniva Inverter: 16,606 kWh
         SunPower Inverter: 39,805 kWh
         Total: 56,411 kWh
  • August 14, 2019 to September 13, 2019: billed for 173 kWh; 665 kWh generated by solar; 428 kWh were generated by the panels on the garage while 237 kWh were generated by the panels on the house. Total electric consumption was 838 kWh. On August 19, 2019, I reported the following to SolSystems:
         Suniva Inverter: 16,882 kWh
         SunPower Inverter: 40,271 kWh
         Total: 57,153 kWh
  • September 13, 2019 to October 14, 2019: billed for 103 kWh; 640 kWh generated by solar; 412 kWh were generated by the panels on the garage while 228 kWh were generated by the panels on the house. Total electric consumption was 743 kWh. On October 6, 2019, I reported the following to SolSystems:
         Suniva Inverter: 17,246 kWh
         SunPower Inverter: 40,926 kWh
         Total: 58,172 kWh
  • October 14, 2019 to November 13, 2019: billed for 238 kWh; 499 kWh generated by solar; 322 kWh were generated by the panels on the garage while 177 kWh were generated by the panels on the house. Total electric consumption was 737 kWh. On November 7, 2019, I reported the following to SolSystems:
         Suniva Inverter: 17,439 kWh
         SunPower Inverter: 41,268 kWh
         Total: 58,707 kWh
  • November 13, 2019 to December 14, 2019: billed for 589 kWh; 372 kWh generated by solar; 239 kWh were generated by the panels on the garage while 133 kWh were generated by the panels on the house. Total electric consumption was 961 kWh. On December 7, 2019, I reported the following to SolSystems:
         Suniva Inverter: 17,577 kWh
         SunPower Inverter: 41,513 kWh
         Total: 59,090 kWh
  • December 14, 2019 to January 15, 2020: billed for 720 kWh; 345 kWh generated by solar; 220 kWh were generated by the panels on the garage while 125 kWh were generated by the panels on the house. Total electric consumption was 1,065 kWh. On January 18, 2020, I reported the following to SolSystems:
         Suniva Inverter: 17,741 kWh
         SunPower Inverter: 41,800 kWh
         Total: 59,541 kWh
  • Close accordion icon

    2020Open accordion icon
  • January 15, 2020 to February 14, 2020: billed for 542 kWh; 403 kWh generated by solar; 258 kWh were generated by the panels on the garage while 145 kWh were generated by the panels on the house. Total electric consumption was 945 kWh. On February 28, 2020, I reported the following to SolSystems:
         Suniva Inverter: 17,969 kWh
         SunPower Inverter: 42,190 kWh
         Total: 60,159 kWh
  • February 14, 2020 to March 16, 2020: billed for 199 kWh; 661 kWh generated by solar; 420 kWh were generated by the panels on the garage while 241 kWh were generated by the panels on the house. Total electric consumption was 860 kWh.
  • March 16, 2020 to April 14, 2020: billed for 198 kWh; 603 kWh generated by solar; 380 kWh were generated by the panels on the garage while 223 kWh were generated by the panels on the house. Total electric consumption was 801 kWh. On March 22, 2020, I reported the following to SolSystems:
         Suniva Inverter: 18,137 kWh
         SunPower Inverter: 42,487 kWh
         Total: 60,624 kWh
  • April 14, 2020 to May 14, 2020: billed for 194 kWh; 687 kWh generated by solar; 428 kWh were generated by the panels on the garage while 259 kWh were generated by the panels on the house. Total electric consumption was 881 kWh. On April 24, 2020, I reported the following to SolSystems:
         Suniva Inverter: 18,402 kWh
         SunPower Inverter: 42,920 kWh
         Total: 61,322 kWh
  • May 14, 2020 to June 15, 2020: billed for 0 kWh; 838 kWh generated by solar; 517 kWh were generated by the panels on the garage while 321 kWh were generated by the panels on the house. Total electric consumption was 819 kWh. On May 30, 2020, I reported the following to SolSystems:
         Suniva Inverter: 18,706 kWh
         SunPower Inverter: 43,410 kWh
         Total: 62,116 kWh
  • June 15, 2020 to July 16, 2020: billed for 141 kWh; 827 kWh generated by solar; 514 kWh were generated by the panels on the garage while 313 kWh were generated by the panels on the house. Total electric consumption was 968 kWh. Note that in July, we were in a heat spell. On June 19, 2020, I reported the following to SolSystems:
         Suniva Inverter: 18,915 kWh
         SunPower Inverter: 43,742 kWh
         Total: 62,657 kWh
  • June 16, 2020 to August 14, 2020: billed for 215 kWh; 725 kWh generated by solar; 458 kWh were generated by the panels on the garage while 267 kWh were generated by the panels on the house. Total electric consumption was 940 kWh.
    I noticed that the crepe myrtle tree nearest the garage is quite tall and might be shading some morning sun that might otherwise fall on the panels. Is the effect measureable? To answer this, I looked back at Suniva versus SunPower solar output from June to July since 2015. These values are 64%, 63%, 64%, 62%, 62%, and 61%. So yes, it might be having an effect but it is small. Perhaps it will be more noticeable in the winter, when the sun is low. That would be a good time for me to trim this tree.
    On July 31, 2020, I reported the following to SolSystems:
         Suniva Inverter: 19,329 kWh
         SunPower Inverter: 44,427 kWh
         Total: 63,756 kWh
  • August 14, 2020 to September 15, 2020: billed for 220 kWh; 675 kWh generated by solar; 433 kWh were generated by the panels on the garage while 242 kWh were generated by the panels on the house. Total electric consumption was 895 kWh. On August 18, 2020, I reported the following to SolSystems:
         Suniva Inverter: 19,475 kWh
         SunPower Inverter: 44,678 kWh
         Total: 64,153 kWh
  • September 15, 2020 to October 16, 2020: billed for 58 kWh; 618 kWh generated by solar; 394 kWh were generated by the panels on the garage while 224 kWh were generated by the panels on the house. Total electric consumption was 676 kWh. On September 30, 2020, I reported the following to SolSystems:
         Suniva Inverter: 19,792 kWh
         SunPower Inverter: 45,238 kWh
         Total: 65,030 kWh
  • October 16, 2020 to November 16, 2020: billed for 473 kWh; 426 kWh generated by solar; 262 kWh were generated by the panels on the garage while 164 kWh were generated by the panels on the house. Total electric consumption was 899 kWh. On November 4, 2020, I reported the following to SolSystems:
         Suniva Inverter: 19,991 kWh
         SunPower Inverter: 45,578 kWh
         Total: 65,569 kWh
  • November 16, 2020 to December 16, 2020: billed for 602 kWh; 392 kWh generated by solar; 251 kWh were generated by the panels on the garage while 145 kWh were generated by the panels on the house. Total electric consumption was 998 kWh. On November 23, 2020, I reported the following to SolSystems:
         Suniva Inverter: 20,097 kWh
         SunPower Inverter: 45,742 kWh
         Total: 65,839 kWh
  • December 16, 2020 to January 15, 2021: billed for 935 kWh; 326 kWh generated by solar; 209 kWh were generated by the panels on the garage while 117 kWh were generated by the panels on the house. Total electric consumption was 1,261 kWh. Note that our electric consumption is higher than normal for this time of year because Norma's mother is staying with us at least until she receives the Covid-19 vaccine. She prefers the house to stay warmer.
    On December 25, 2020, I reported the following to SolSystems:
         Suniva Inverter: 20,230 kWh
         SunPower Inverter: 45,971 kWh
         Total: 66,201 kWh
  • Close accordion icon

    2021Open accordion icon
  • January 15, 2021 to February 16, 2021: billed for 1,007 kWh; 350 kWh generated by solar; 221 kWh were generated by the panels on the garage while 129 kWh were generated by the panels on the house. Total electric consumption was 1,357 kWh. We had quite a bit of snow. On January 30, 2021, I reported the following to SolSystems:
         Suniva Inverter: 20,398 kWh
         SunPower Inverter: 46,263 kWh
         Total: 66,661 kWh
  • February 16, 2021 to March 17, 2021: billed for 481 kWh; 606 kWh generated by solar; 386 kWh were generated by the panels on the garage while 220 kWh were generated by the panels on the house. Total electric consumption was 1,087 kWh. On February 28, 2021, I reported the following to SolSystems:
         Suniva Inverter: 20,522 kWh
         SunPower Inverter: 46,471 kWh
         Total: 66,993 kWh
  • March 17, 2021 to April 16, 2021: billed for 120 kWh; 683 kWh generated by solar; 439 kWh were generated by the panels on the garage while 244 kWh were generated by the panels on the house. Total electric consumption was 803 kWh. On March 25, 2021, I reported the following to SolSystems:
         Suniva Inverter: 20,730 kWh
         SunPower Inverter: 46,844 kWh
         Total: 67,574 kWh
  • April 16, 2021 to May 18, 2021: billed for 126 kWh; 835 kWh generated by solar; 540 kWh were generated by the panels on the garage while 295 kWh were generated by the panels on the house. Total electric consumption was 961 kWh. On April 30, 2021, I reported the following to SolSystems:
         Suniva Inverter: 21,048 kWh
         SunPower Inverter: 47,410 kWh
         Total: 68,458 kWh
  • May 18, 2021 to June 17, 2021: billed for 84 kWh; 746 kWh generated by solar; 476 kWh were generated by the panels on the garage while 270 kWh were generated by the panels on the house. Total electric consumption was 830 kWh. On May 29, 2021, I reported the following to SolSystems:
         Suniva Inverter: 21,305 kWh
         SunPower Inverter: 47,868 kWh
         Total: 69,173 kWh
  • June 17, 2021 to July 19, 2021: billed for 137 kWh; 765 kWh generated by solar; 535 kWh were generated by the panels on the garage while 230 kWh were generated by the penels on the house. Total electric consumption was 902 kWh. On June 26, 2021, I reported the following to SolSystems:
         Suniva Inverter: 21,552 kWh
         SunPower Inverter: 48,294 kWh
         Total: 69,846 kWh
  • July 19, 2021 to August 18, 2021: billed for 468 kWh; 477 kWh generated by solar; 477 kWh were generated by the panels on the garage while 0 kWh were generated by the panels on the house. Total electric consumption was 945 kWh. On July 25, 2021, I reported the following to SolSystems:
         Suniva Inverter: 21,691 kWh
         SunPower Inverter: 48,768 kWh
         Total: 70,459 kWh
    The Suniva inverter reported small gains. This is because the inverter had problems, which I documented at Troubleshooting.
  • August 18, 2021 to September 17, 2021: billed for 407 kWh; 486 kWh generated by solar; 437 kWh were generated by the panels on the garage while 49 kWh were generated by the penels on the house. Total electric consumption was 893 kWh. The inverter for the Suniva panels was fixed on September 11, 2021.
  • September 17, 2021 to October 15, 2021: billed for 119 kWh; 508 kWh generated by solar; 332 kWh were generated by the panels on the garage while 176 kWh were generated by the penels on the house. Total electric consumption was 627 kWh. On September 29, 2021, I reported the following to SolSystems:
         Suniva Inverter: 21,831 kWh
         SunPower Inverter: 49,721 kWh
         Total: 71,552 kWh
  • October 15, 2021 to November 15, 2021: billed for 176 kWh; 467 kWh generated by solar; 302 kWh were generated by the panels on the garage while 165 kWh were generated by the penels on the house. Total electric consumption was 643 kWh. On October 30, 2021, I reported the following to SolSystems:
         Suniva Inverter: 22,007 kWh
         SunPower Inverter: 50,045 kWh
         Total: 72,052 kWh
  • November 15, 2021 to December 15, 2021: billed for 469 kWh; 419 kWh generated by solar; 272 kWh were generated by the panels on the garage while 147 kWh were generated by the penels on the house. Total electric consumption was 888 kWh. On November 30, 2021, I reported the following to SolSystems:
         Suniva Inverter: 22,185 kWh
         SunPower Inverter: 50,362 kWh
         Total: 72,547 kWh
  • On December 28, 2021, I reported the following to SolSystems:
         Suniva Inverter: 22,303 kWh
         SunPower Inverter: 50,573 kWh
         Total: 72,876 kWh
  • Close accordion icon

    At the end of 2021, I decided I would stop documenting the amount of electricity my panels generated. Things were stable and I felt I had more than enough data to work with.
    Close accordion icon


     Evaluation

    TroubleshootingOpen accordion icon
    I would love to say that my experience with the photovoltaic solar panels was just a matter of getting them turned on and then never having to deal with them. Unfortunately, that has not been the case. Sometimes it takes awhile for technology to mature and for problems to get identified and later resolved. I expect that people getting solar panels now will have significantly less problems than I did.

    My SunPower web page provided me with electric generation reports. So did my SunPower Wireless Display SPR-PMR-WDISP. But they did not agree. The discrepancy was significant. Geoff M. of Solar Energy World told me that the wireless display is not accurate and has been discontinued due to its unreliability.

    Danny P. mentioned the following:
    Typically when the monitoring drops out, your system is still producing power [but] you just can't see it on the website. You can verify this by looking at the SunPower inverter mounted on your garage. If you have a solid green light during the day you are not losing any production. Keep in mind the inverters are not considered revenue grade meters. The data they are displaying is +/- 5%. The solar meter we installed is the only device that is considered to be revenue grade which is +/- 2%. The meter is the most accurate measuring device in the entire system.

    I've had much greater success with the Suniva panels, which are on the house. Normally, these generate about 65% as much electricity as the SunPower panels on the garage. This relationship helps let me know if one of them is having problems. It is sort of like having two beehives.

    On August 27, 2014, Norma and I returned from our vacation. I checked the output from the solar panels and found that the SunPower panels were failing to show energy generation on days that they should. It started on August 12 where the dashboard only showed 0.74 kwh generation. Then on August 13-16, it showed no generation.
    Sunpower website report for August 2014

    In contrast, the Suniva panels generated 51.32 kwh over the same period.
    Suniva website report for August 2014

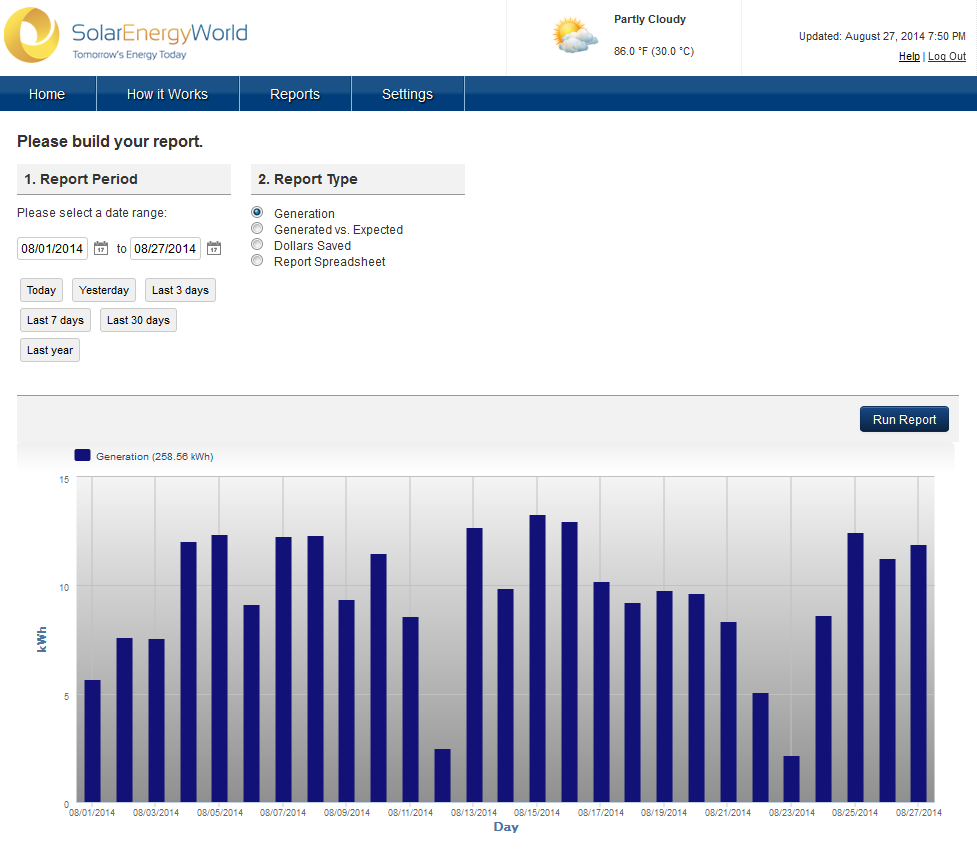
    This means the SunPower panels should have produced about 78 kwh. The next day, I called Abby at SunPower, 1-800-786-7693. She had a note from Jeff Thomas of Solar Energy World describing my problem and SunPower had started tracking my system on August 6. She consulted with an engineer and assured me that the problem is with monitoring and not with the system producing electricity. She said that the system could have been reset and I should call again if I have the same problem. They will note it in their records. I explained that SolSystems uses this SunPower website to determine how many SRECs I've earned. She was not familiar with SolSystems so I told her it is an SREC brokerage firm. They need to accurately measure how much electricity my solar panels generate in order to ensure I get the SRECs I deserve. If the SunPower site does not reflect this, then I am not getting my fair share of SRECs. On September 1, 2014, I sent her this information along with a link to the SolSystems website by sending an email to customersupport@sunpower.com and including "Attn: Abby" in the subject. She did NOT get back to me. Very disappointing.

    On September 25 and 26, 2014, I found that my SunPower dashboard failed to record the day's energy production. There was sun, yet it recorded zero electricity generation.
    SunPower website report for September 26, 2014

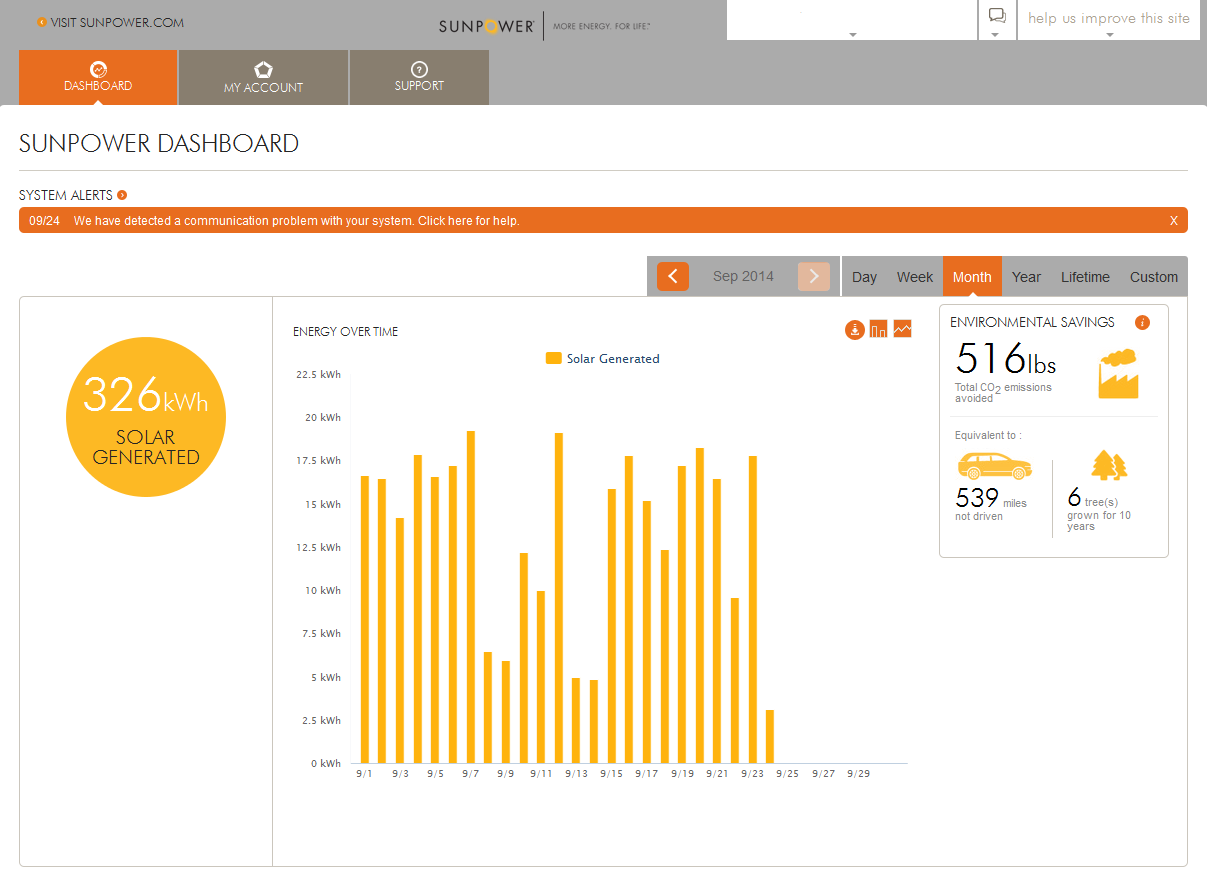
    In contrast, my Suniva panels generated 3.92 and 3.01 kWh on the 25th and 26th, respectively. This means my SunPower panels should have produced about 6.125 and 4.703 kWh on these days, respectively. Note that in the above image, the dashboard reports that the problem started on September 24 with the message
         We have detected a communication problem with your system. Click here for help.
    I clicked it and got the message
         TROUBLESHOOTING: LOST CONNECTION
         Lease system customers, please call: 1-800-SUNPOWER.
         Non-leased system owners, please contact your Dealer.
         Dealer Name : Solar Energy World
    I checked my SunPower inverter which records the number of kWh generated by these panels and it did indeed verify that even though the dashboard did not report energy generation, power was being generated.

    In August/September 2015, I had to approximate how much energy my SunPower panels produced because there were issues with the SunPower website. I informed them of the problem on September 20, 2015. It is possible the problem was with the transmitter because no report was produced for August 14 to September 8. But when I went back a month prior and tried to review data that I know existed a month ago, all I got was a message that said "Waiting for Data" (see image below). An hour later, it said the same thing. Thus, my approximation is based on the proportion of energy the SunPower panels produced relative to the Suniva panels for the latest reading.
    SunPower website snapshot showing 'Waiting for Data'

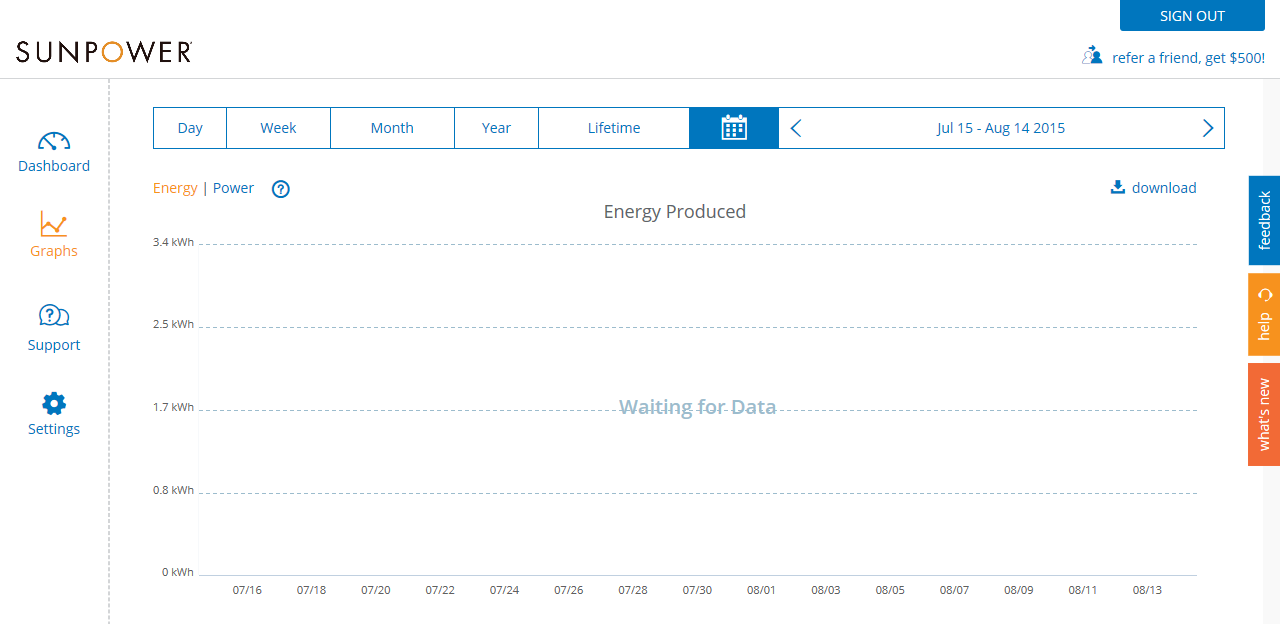
    On October 24, 2015, I reported the SunPower website issues to Christine P. She replied back to me with the following:
    The data logger device doesn't have the capability to save the data if it has been reset or if it was down and therefore cannot be retrieved.

    On September 25, 2015, Christine P. sent me an e-mail to inform me that the problem with their website, which I reported on September 20, was fixed. It turns out my panels on the garage actually generated 567 kWh of electricity from August 14, 2015 to September 15, 2015. My earlier estimate was 558 kWh so I was off by 9 kWh 1.6%.

    On July 12, 2021, the Suniva panels quit registering electric production. The inverter reported an error message that read
         Error! Int.Error E031
    Someone from Solar Energy World came out to look at it on July 28. He determined that the inverter is faulty. It is still under warranty and it will take 10-12 business days for a replacement to arrive. At that time, they will call me to schedule a time to come out and do their work.
    As of August 20, 2021, I haven't heard back from Solar Energy World regarding the faulty inverter. I called them and received a call back from Stephanie . She called PowerOne, the manufacturer, who told her there is a worldwide shortage on parts and replacements. Currently there is a four week turnaround but they cannot guarantee a date. Everything has been approved and they are just waiting for the part to come in. Eventually, this got resolved.
    I've had lots of problems with SunPower equipment but this was perhaps the first time I had any issues with Suniva.

    Problems can occur with any piece of equipment. That's why it is so important to choose a product and an installer that will be around for awhile. I can't imagine what I would have done if either had gone out of business and left me hanging.
    Close accordion icon

    First yearOpen accordion icon
    In this section, I evaluate performance during the first year of solar photovoltaic use, December 8, 2010 to December 7, 2011: Actually, energy was generated on December 7, 2010 but for only half a day so I'm starting at the first full day of energy generation.
  • Total energy generated by solar panels: 4,776 kWh
  • Average daily generation: 13.08 kWh
  • Money saved through electricity savings based on Dominion 2011 electricity rate of $0.0919 per kWh: $438.91
  • Considering delivery service, taxes, and surcharges that are a function of the amount of electricity purchased, the actual total rate is $0.1163454 per kWh, which equates to an annual savings of $555.66
  • BGE delivery service, taxes, or surcharges average out to about $15.01 per month or $180.08 per year. This is based on our last three electric bills for 2011.
  • Total amount of electricity purchased from December 13, 2010 to December 12, 2011: 2,795 kWh; this equates to $256.86 for the electricity alone or $325.18 after delivery service, taxes, and surcharges that are a function of the amount of electricity purchased
  • Total amount of electricity consumed: 4,776 + 2,795 = 7,571 kWh
  • Solar panels provided 100 * (4776/7571) = 63% of our electricity

  • Taking this into consideration, had we not had solar panels, the cost of electricity alone purchased for 2011 would have been $438.91 + $256.86 = $695.77 while our total electric bill (with fees) would have been $695.77 + $180.08 = $875.85. With solar panels, our electric bill for 2011 was $256.86 + $180.08 = $436.94.

    If you add to this our annual heating cost of $867.10 (based on oil heat cutting and monitoring costs), then our annual energy cost in 2011 was $867.10 + $436.94 = $1,304.04. Without solar panels, it would have been $867.10 + $875.85 = $1,742.95.

    How does this compare to what Solar Energy World predicted?
    They expected the panels would provide 48% of our electricity so we're actually doing significantly better. They also claimed we'd save $568 per year based on our 2009/2010 energy consumption. They were off by only 2%! Overall, we are quite pleased with the results.

    I did not sell any SRECs in 2011 but had I sold the four I generated (one for each megawatt hour) at the November 2011 clearing priced of $210, I would have made $840.

    The amount of electricity generated by my solar panels in one year had a signficant effect on the environment by offsetting the amount produced by conventional means. How can one compare generating 4,776 kWh of solar energy?
  • My carbon footprint was reduced by an amount equivalent to 7,926 pounds of carbon dioxide.
  • Emissions were reduced by an amount equivalent to planting 88 seedlings that were then grown for 10 years.
  • Emissions were reduced by an amount equivalent to not driving 7,849 miles in a standard car.
  • - based on SunPower website
    Close accordion icon

    Reducing heating costOpen accordion icon
    According to a BGE Home folder I received, the annual energy bill for an average home is about $2,200. So even without the help of solar energy, our energy costs are about 1,742.95/2,200 = 79% of average. But is it really?

    According to the National Association of Home Builders, the average home size in the United States was 2,700 square feet in 2009, up from 1,400 square feet in 1970.
    - from U.S. Home Size - Infoplease.com

    Our house has a finished square footage of 1,240. This means it is 1,240/2,700 = 46% the size of the average American home. But our pre-solar energy costs are not 46% the amount that the average American pays (I assume a linear relationship). With the help of solar, our energy costs are only 1,304.04/2,200 = 59% of what the average American pays.

    So where are we weak? In the BGE Home folder, non-heating costs account for 71% while heating costs account for 29%. Pre-solar, our non-heating costs account for 875.85/1742.95 = 50% while our heating costs account for 867.10/1742.95 = 50%. With the help of solar, our non-heating costs account for 436.94/1304.04 = 34% while our heating costs account for 867.10/1304.04 = 66%. Clearly, we are paying too much to heat our house. But in reality, these numbers don't tell the whole truth since heating and water heating are broken down into two different categories with water heating accounting for 14% of the average energy cost for a home. Our water heater is electric but it is supported by the oil heater in the winter. How much of it is supported by oil is something I do not know. But what I do know is that our heating costs are more than what they should be.

    Clearly there is room for improvement. On November 15, 2012, this improvement took place with the installation of a geothermal heat pump.
    Close accordion icon

    Net meterOpen accordion icon
    On December 20, 2010, a technician from BGE came out and replaced my electric meter with a new one. This new net meter runs backwards as well as forward. Hence, if my panels generate more energy than we use (as one might expect on a sunny day when we're not home), excess electricity will be fed back into the grid and our net meter will run backwards.

    On August 16, 2013, I received a new net meter. I'm not sure why the last one wasn't sufficient but maybe this new one is also a smart meter that the utility company uses to gather more information about usage. Anyway, that afternoon, I noticed that the reading was 99,991, meaning that I produced 9 kwh more than I used.

    On August 16, 2014, our net meter read 880 kwh at the end of the day. This is exactly one year after it was installed. If I was electrically net zero, then it would have read zero or negative. Clearly I am far from this and have lots of room to improve. I blame the excessively cold winter, the fact that the geothermal heat pump was not working properly for much of the winter, and the energy used by the chickens' heat lamp (220 watts for 24 hours a day, 7 days a week, for about 5 weeks = ~185 kwh). Also, we still use some incandescent bulbs that we're waiting to have burn out so we can replace with energy-efficient LED. Yes, those are my excuses and I'm sticking to them. But the truth of the matter is that even without those obstacles, I really don't think we would have been net zero.
    Close accordion icon

    Total savingsOpen accordion icon
    Perhaps the biggest questions are, "How much money have solar photovoltaic panels saved me" and "When will these panels pay for themselves?" I spent a lot of time gathering data to answer these questions.

    2011Open accordion icon
  • $7,345.50 federal tax refund for SunPower solar panels. $3,042 federal tax refund for Suniva solar panels. Total: $10,387.50 total federal tax refund.
  • $22.24 for December 13, 2010 to January 14, 2011 electric charges alone or $28.16 for total bill.
  • $26.29 for January 14, 2011 to February 14, 2011 electric charges alone or $33.28 for total bill.
  • $37.13 for February 14, 2011 to March 14, 2011 electric charges alone or $47.01 for total bill.
  • $41.54 for March 14, 2011 to April 14, 2011 electric charges alone or $52.59 for total bill.
  • $42.02 for April 14, 2011 to May 14, 2011 electric charges alone or $53.20 for total bill.
  • $55.05 for May 14, 2011 to June 16, 2011 electric charges alone or $69.69 for total bill.
  • $1,840 Maryland state grant for solar panels.
  • $51.46 for June 16, 2011 to July 16, 2011 electric charges alone or $65.15 for total bill.
  • $46.59 for July 16, 2011 to August 12, 2011 electric charges alone or $58.98 for total bill.
  • $42.37 for August 12, 2011 to September 15, 2011 electric charges alone or $53.64 for total bill.
  • $40.25 for September 15, 2011 to October 15, 2011 electric charges alone or $50.96 for total bill.
  • $30.79 for October 15, 2011 to November 12, 2011 electric charges alone or $38.98 for total bill.
  • $23.71 for November 12, 2011 to December 12, 2011 electric charges alone or $30.02 for total bill.
  • Close accordion icon

    2012Open accordion icon
  • $22.49 for December 12, 2011 to January 14, 2012 electric charges alone or $28.47 for total bill.
  • $70.84 for January 14, 2012 to March 14, 2012 electric charges alone or $89.68 for total bill.
  • $41.89 for March 14 to April 13, 2012 electric charges alone or $53.03 for total bill.
  • $45.22 for April 13, 2012 to May 15, 2012 electric charges alone or $61.60 for total bill.
  • $49.48 for May 15, 2012 to June 14, 2012 electric charges alone or $67.54 for total bill.
  • $48.25 for June 14, 2012 to July 14, 2012 electric charges alone or $67.30 for total bill.
  • $47.10 for July 14, 2012 to August 16, 2012 electric charges alone or $65.69 for total bill.
  • $42.84 for August 16, 2012 to September 15, 2012 electric charges alone or $59.76 for total bill.
  • $36.28 for September 15, 2012 to October 15, 2012 electric charges alone or $50.61 for total bill.
  • $26.35 for October 15, 2012 to November 13, 2012 electric charges alone or $35.89 for total bill.
  • $20.49 for November 13 to December 12, 2012 electric charges alone or $28.54 for total bill.
  • Close accordion icon

    2013Open accordion icon
  • $18.54 for December 12, 2012 to January 14, 2013 electric charges alone or $25.42 for total bill.
  • $19.09 for January 14, 2013 to February 13, 2013 electric charges alone or $27.37 for total bill.
  • $28.20 for February 13, 2013 to March 14, 2013 electric charges alone or $41.85 for total bill.
  • $35.52 for March 14, 2013 to April 12, 2013 electric charges alone or $53.16 for total bill.
  • $1,097.54 for selling 10 SRECs on May 28, 2013 via SolSystems.
  • $41.99 for April 12, 2013 to May 14, 2013 electric charges alone or $60.69 for total bill.
  • July 2013: $2,801.68 for Howard County property tax credit.
  • $37 for May 14, 2013 to June 13, 2013 electric charges alone or $53.17 for total bill.
  • $36.38 for June 13, 2013 to July 15, 2013 electric charges alone or $52.69 for total bill.
  • $46.08 for July 15, 2013 to August 15, 2013 electric charges alone or $68.84 for total bill. Around this time, I started generating 2.256 SRECs per year for my solar hot water heater. These are added to my photovoltaic SREC generation. So it makes things a little more difficult to tell how things are paying for themselves.
  • $252.96 for selling two SRECs on August 29, 2013 via SolSystems.
  • In Monthly tracking - 2013, I mentioned that for the August 15 to November 13, 2013 period, we were billed for 0 kWh and in fact had a surplus. But this didn't mean our bill was zero. It just meant our only charges were three months of fees to include $7.50 per month for the "BGE Electric Delivery Service" and $0.37 per month for the "State/Local Taxes and Surcharges." This came to $23.61 or $7.87 per month. To estimate our savings, I looked at our energy usage for the same period in the previous year. This came to 660 + 642 + 572 = 1,874 kWh. Using the rates from my August 15, 2013 statement, I assume our rate is $0.0779 per kWh for electricity alone or $0.11158 per kWh for total costs to include fees and taxes. This means that for this period, the solar panels saved us $145.98 in electric costs alone or $209.10 - $23.61 = $185.49 in total costs.
    I use this same logic going forward to estimate savings where we are billed for 0 kWh but have a surplus.
  • $128 for selling one SREC on November 25, 2013 via SolSystems.
  • $57.72 for November 13, 2013 to December 13, 2013 electric charges alone or $74.81 for total bill.
  • Close accordion icon

    2014Open accordion icon
  • $26.80 for December 13, 2013 to January 15, 2014 electric charges alone or $38.17 for total bill.
  • $27.83 for January 15, 2014 to February 13, 2014 electric charges alone or $39.61 for total bill.
  • $137.95 for selling one SREC in March 2014 via SolSystems.
  • $42.86 for February 13, 2014 to March 13, 2014 electric charges alone or $60.83 for total bill.
  • $58.07 for March 13, 2014 to April 14, 2014 electric charges alone or $82.39 for total bill.
  • Mid-April to mid-May 2014 estimated total consumption = 729 kWh; total savings estimate = (729 x $0.0859) - $7.86 = $54.76 in electric charges alone or (729 x $0.12188) - $7.86 = $80.99 for total bill. The process for obtaining this estimate is described in 2013.
  • Mid-May to mid-June 2014 estimated total consumption = 800 kWh; total savings estimate = (800 x $0.0859) - $7.86 = $60.86 in electric charges alone or (800 x $0.12188) - $7.86 = $89.64 for total bill.
  • July 2014: $2,198.32 for Howard County property tax credit.
  • Mid-June to mid-July 2014 estimated total consumption = 748 kWh; total savings estimate = (748 x $0.0859) - $7.86 = $56.39 in electric charges alone or (748 x $0.12188) - $7.86 = $83.31 for total bill.
  • $239.68 for selling two SRECs in August 2014 via SolSystems.
  • $46.89 for July 15, 2014 to August 14, 2014 electric charges alone or $69.09 for total bill.
  • $48.83 for August 14, 2014 to September 15, 2014 electric charges alone or $72.58 for total bill.
  • $47.29 for September 15, 2014 to October 15, 2014 electric charges alone or $70.39 for total bill.
  • $50.04 for October 15, 2014 to November 13, 2014 electric charges alone or $74.29 for total bill.
  • $68.33 for November 13, 2014 to December 12, 2014 electric charges alone or $100.25 for total bill.
  • Close accordion icon

    2015Open accordion icon
  • $28.69 for December 12, 2014 to January 14, 2015 electric charges alone or $43.92 for total bill. Surplus credit electricity ran out in December.
  • $34.36 for January 14, 2015 to February 13, 2015 electric charges alone or $52.80 for total bill.
  • $308.44 for selling two SRECs on March 2, 2015 via SolSystems.
  • $23.88 for February 13, 2015 to March 13, 2015 electric charges alone or $35.15 for total bill.
  • $65.03 for March 13, 2015 to April 14, 2015 electric charges alone or $94.70 for total bill.
  • $64.73 for April 14, 2015 to May 13, 2015 electric charges alone or $97.85 for total bill.
  • $73.40 for May 13, 2015 to June 15, 2015 electric charges alone or $110.48 for total bill.
  • $150.44 for selling one SREC on June 1, 2015 via SolSystems.
  • $59.74 for June 15, 2015 to July 15, 2015 electric charges alone or $90.58 for total bill.
  • $68.72 for July 15, 2015 to August 14, 2015 electric charges alone or $102.36 for total bill.
  • $497.07 for selling three SRECs on September 4, 2015 via SolSystems.
  • $73.96 for August 14, 2015 to September 15, 2015 electric charges alone or $108.73 for total bill.
  • $42.39 for September 15, 2015 to October 14, 2015 electric charges alone or $65.32 for total bill.
  • $34.23 for October 14, 2015 to November 12, 2015 electric charges alone or $53.44 for total bill.
  • $316.78 for selling two SRECs on December 3, 2015 via SolSystems.
  • $29.33 for November 12, 2015 to December 12, 2015 electric charges alone or $46.41 for total bill.
  • Close accordion icon

    2016Open accordion icon
  • $21.60 for December 12, 2015 to January 14, 2016 electric charges alone or $37.47 for total bill.
  • $20.06 for January 14, 2016 to February 12, 2016 electric charges alone or $35.09 for total bill.
  • $372.66 for selling three SRECs on March 10, 2016 via SolSystems.
  • $41.02 for February 12, 2016 to March 14, 2016 electric charges alone or $67.40 for total bill.
  • $61.33 for March 14, 2016 to April 14, 2016 electric charges alone or $99.13 for total bill.
  • $8.74 for once a year refund for excess power generation paid by BGE.
  • $45.63 for April 14, 2016 to May 13, 2016 electric charges alone or $74.84 for total bill.
  • $67.78 for selling two SRECs on May 31, 2016 via SolSystems. $33.89 each. Not sure why the price dropped so much.
  • $69.43 for May 13, 2016 to June 15, 2016 electric charges alone or $111.72 for total bill.
  • $61.87 for June 15, 2016 to July 14, 2016 electric charges alone or $100.17 for total bill.
  • $67.81 for July 14, 2016 to August 15, 2016 electric charges alone or $109.36 for total bill.
  • $69.72 for selling three SRECs on August 30, 2016. $23.24 each. In less than 10 months, the value of SRECs went from $158.39 to $23.24. They are worth about 15% what they were.
  • $66.03 for August 15, 2016 to September 15, 2016 electric charges alone or $106.60 for total bill.
  • $36.48 for September 15, 2016 to October 14, 2016 electric charges alone or $60.92 for total bill.
  • $45.91 for October 14, 2016 to November 14, 2016 electric charges alone or $75.49 for total bill.
  • $44.34 for selling three SRECs on November 29, 2016. Compared with my sale on December 3, 2015, the value of SRECs has dropped over 90% in less than a year.
  • $27.31 for November 14, 2016 to December 14, 2016 electric charges alone or $46.74 for total bill.
  • Close accordion icon

    2017Open accordion icon
  • $20.10 for December 14, 2016 to January 14, 2017 electric charges alone or $34.92 for total bill.
  • $13.59 for selling one SREC on February 27, 2017.
  • $47.86 for February 13, 2017 to March 14, 2017 electric charges alone or $79.40 for total bill.
  • $49.73 for March 14, 2017 to April 13, 2017 electric charges alone or $81.06 for total bill.
  • $41.34 for April 13, 2017 to May 12, 2017 electric charges alone or $70.95 for total bill.
  • On May 17, 2017, we received a check for $4.61 as a result of surplus electric generation. This is something BGE does at the end of April each year.
  • $58.10 for May 12, 2017 to June 15, 2017 electric charges alone or $97.71 for total bill.
  • $14.58 for selling three SRECs on June 8, 2017.
  • $54.02 for June 15, 2017 to July 14, 2017 electric charges alone or $90.97 for total bill.
  • $51.39 for July 14, 2017 to August 14, 2017 electric charges alone or $86.78 for total bill.
  • $47.72 for August 14, 2017 to September 15, 2017 electric charges alone or $81.14 for total bill.
  • $37.26 for September 15, 2017 to October 14, 2017 electric charges alone or $64.44 for total bill.
  • $32.65 for October 14, 2017 to November 13, 2017 electric charges alone or $57.07 for total bill.
  • $25.73 for November 13, 2017 to December 13, 2017 electric charges alone or $46.02 for total bill.
  • Close accordion icon

    2018Open accordion icon
  • $32.30 for December 13, 2017 to January 16, 2018 electric charges alone or $51.74 for total bill.
  • $29.15 for January 16, 2018 to February 13, 2018 electric charges alone or $45.50 for total bill.
  • $22.31 for selling seven SRECs on February 27, 2018.
  • $37.53 for February 13, 2018 to March 14, 2018 electric charges alone or $57.86 for total bill.
  • $51.68 for March 14, 2018 to April 13, 2018 electric charges alone or $80.47 for total bill.
  • $54.11 for April 13, 2018 to May 14, 2018 electric charges alone or $88.85 for total bill.
  • $14.66 for selling two SRECs on May 30, 2018.
  • $51.68 for May 14, 2018 to June 14, 2018 electric charges alone or $78.62 for total bill.
  • $59.57 for June 14, 2018 to July 16, 2018 electric charges alone or $94.93 for total bill.
  • $53.29 for July 16, 2018 to August 14, 2018 electric charges alone or $82.98 for total bill.
  • $12.78 for selling three SRECs on August 27, 2018.
  • $47.05 for August 14, 2018 to September 13, 2018 electric charges alone or $74.37 for total bill.
  • $32.50 for September 13, 2018 to October 12, 2018 electric charges alone or $50.17 for total bill.
  • $38.71 for October 12, 2018 to November 12, 2018 electric charges alone or $59.74 for total bill.
  • $27.27 for November 12, 2018 to December 13, 2018 electric charges alone or $41.70 for total bill.
  • Close accordion icon

    2019Open accordion icon
  • $22.46 for December 13, 2018 to January 14, 2019 electric charges alone or $33.76 for total bill.
  • $25.23 for January 14, 2019 to February 13, 2019 electric charges alone or $39.20 for total bill.
  • $10.09 for selling two SRECs on February 25, 2019.
  • $36.82 for February 13, 2019 to March 14, 2019 electric charges alone or $56.99 for total bill.
  • $52.70 for March 14, 2019 to April 12, 2019 electric charges alone or $83.43 for total bill.
  • $46.69 for April 12, 2019 to May 13, 2019 electric charges alone or $73.73 for total bill.
  • $55.65 for May 13, 2019 to June 14, 2019 electric charges alone or $92.64 for total bill.
  • $57.83 for June 14, 2019 to July 16, 2019 electric charges alone or $96.07 for total bill.
  • $49.22 for July 16, 2019 to August 14, 2019 electric charges alone or $82.26 for total bill.
  • $43.95 for selling one SREC on August 29, 2019.
  • $48.48 for August 14, 2019 to September 13, 2019 electric charges alone or $76.99 for total bill.
  • $46.66 for September 13, 2019 to October 14, 2019 electric charges alone or $74.17 for total bill.
  • $36.38 for October 14, 2019 to November 13, 2019 electric charges alone or $55.12 for total bill.
  • $27.12 for November 13, 2019 to December 14, 2019 electric charges alone or $41.75 for total bill.
  • Close accordion icon

    2020Open accordion icon
  • $25.15 for December 14, 2019 to January 15, 2020 electric charges alone or $39.34 for total bill.
  • $1036.20 for selling 15 SRECs on February 28, 2020.
  • $29.38 for January 15, 2020 to February 14, 2020 electric charges alone or $47.66 for total bill.
  • $48.19 for February 14, 2020 to March 16, 2020 electric charges alone or $78.83 for total bill.
  • $43.96 for March 16, 2020 to April 14, 2020 electric charges alone or $71.92 for total bill.
  • $50.08 for April 14, 2020 to May 14, 2020 for electric charges alone or $82.19 for total bill.
  • $197.73 for selling three SRECs on June 1, 2020.
  • $52.77 for May 14, 2020 to June 15, 2020 for electric charges alone or $91.93 for total bill.
  • $60.29 for June 15, 2020 to July 17, 2020 for electric charges alone or $99.07 for total bill.
  • $52.85 for July 17, 2020 to August 14, 2020 for electric charges alone or $82.69 for total bill.
  • $139.12 for selling two SRECs on August 28, 2020.
  • $49.21 for August 14, 2020 to September 15, 2020 for electric charges alone or $76.12 for total bill.
  • $45.05 for September 15, 2020 to October 16, 2020 for electric charges alone or $69.67 for total bill.
  • $31.06 for October 16, 2020 to November 16, 2020 for electric charges alone or $48.02 for total bill.
  • $215.16 for selling three SRECs on November 25, 2020.
  • $28.87 for November 16, 2020 to December 16, 2020 for electric charges alone or $44.64 for total bill.
  • Close accordion icon

    2021Open accordion icon
  • $23.77 for December 16, 2020 to January 15, 2021 for electric charges alone or $36.07 for total bill.
  • $144.40 for selling two SRECs on February 26, 2021.
  • $25.52 for January 15, 2021 to February 16, 2021 for electric charges alone or $38.96 for total bill.
  • $44.18 for February 16, 2021 to March 17, 2021 for electric charges alone or $68.96 for total bill.
  • $49.79 for March 17, 2021 to April 16, 2021 for electric charges alone or $77.08 for total bill.
  • $60.87 for April 16, 2021 to May 18, 2021 for electric charges alone or $99.31 for total bill.
  • $142.38 for selling two SRECs on May 28, 2021.
  • $54.38 for May 18, 2021 to June 17, 2021 for electric charges alone or $88.53 for total bill.
  • $55.77 for June 17, 2021 to July 19, 2021 for electric charges alone or $88.75 for total bill.
  • Two SRECs sold for $142.30 on September 1, 2021.
  • $34.77 for July 19, 2021 to August 18, 2021 for electric charges alone or $54.72 for total bill.
  • $35.43 for August 18, 2021 to September 17, 2021 for electric charges alone or $55.76 for total bill.
  • $49.23 for September 17, 2021 to October 15, 2021 for electric charges alone or $70.47 for total bill.
  • $41.45 for October 15, 2021 to November 15, 2021 for electric charges alone or $58.32 for total bill.
  • Three SRECs sold for $214.57 on November 22, 2021.
  • $31.38 for November 15, 2021 to December 15, 2021 for electric charges alone or $49.91 for total bill.
  • Close accordion icon

    ConclusionOpen accordion icon
    I decided to stop tracking how much money my solar panels save me and when, if ever, they will pay for themselves. Part of this decision is that after 11 years, I have grown tired of doing this. Another reason is that tracking this information is getting more difficult because SunPower is moving the data I need from their website to an app, which is not as user-friendly as I would like. So this is my final entry and interpolation for this section.

    My first panels became operational on December 7, 2010.
    As of January 1, 2021, I have earned $6,435.13 for selling 89 SRECs.
    On July 29, 2013, my solar water heater (thermal) was installed. Prior to this, I had 10 SRECs which earned me $1,097.54, purely from photovoltaic panels. This means the other 79 were earned while I had both photovoltaic and thermal panels. My solar water heater earns me a fixed 2.256 SRECs per year or 2.256 * 8.5 = 19.176 SRECs to date. This means the solar water heater has earned me 19.176/79 * ($6,435.13 - $1,097.54) = $1,295.61 in SREC money. The rest of the money, $6,435.13 - $1,295.61 = $5,139.52 is SREC money earned from photovoltaic panels.
    I received a $10,387.50 federal tax refund.
    I received a $1,840 Maryland state grant.
    I received a $5,000 Howard County property tax credit.
    I have saved $5,651.79 in electric costs alone. If you consider the total bill, to include taxes calculated as a function of electric costs, I have saved $8,557.24. This averages out to $42.82 per month for electric costs alone or $64.83 per month for the total bill.
    This means that after 11 years, my photovoltaic panels have saved or earned me $5,139.52 + $10,387.50 + $1,840 + $5,000 + $8,557.24 = $30,924.26.
    Note that the total cost of the photovoltaic panels is $34,625. This is based on $24,485 for 16 SunPower panels on garage plus $10,140 for 10 Suniva panels on house.
    My photovoltaic panels have not paid for themselves but they are $30,924.26/$34,625 = 89.3% paid for.

    When will they be paid for? Tax refunds/credits and grants are one time deals. But money from SRECs and savings from electric bills are recurring.
    SRECs are nowhere near as valuable as they used to be. Looking at SRECs over the last three years from 2019 to 2021, I have sold 35 for $2,286. This averages $65.31 per SREC and 11.67 SRECs per year worth $762. But since the solar water heater earns 2.256 of these SRECs per year, the photovoltaic panels actually average 11.67 - 2.256 = 9.414 SRECs per year worth ($762 x 9.414)/11.67 = $614.69.

    Over one year, I can expect to save $513.84 in electric costs alone or $777.96 for the total bill. Putting things together, each year going forward, I estimate my photovoltaic panels saving me $614.69 + $777.96 = $1,392.65 per year.
    I need to save another $34,625 - $30,924.26 = $3,700.74 before my photovoltaic panels pay for themselves. It should take approximately $3,700.74/$1,392.65 = 2.66 years to accomplish this. So I am looking at a payoff date of around late August 2024.

    As of December 2023, I am making $52.62 for selling one SREC. I won't recalculate the payoff date but it is now definitely later than August 2024.

    Were the photovoltaic panels a good financial investment? In my opinion, no. I could have taken that $34,625, put it in the stock market, and ended up with about $114,000, as of 2021. Even a modest interest rate savings account would have given me roughly $53,000. But investing in green technology is helping create a greener tomorrow, not about making money.
    Close accordion icon
    Close accordion icon


     Other savings

    Choosing providersOpen accordion icon
    One thing I did in 2011 to save money was change electric providers. Despite having solar panels, we still need to buy electricity. So why pay more for it when I don't have to? After the utility companies were deregulated, customers had a choice. By default, we have BGE, who, as of January 2011, charges 10.029 cents per kWh. But there are other choices available at
  • Compare BGE Rates
  • BGE Energy Suppliers
  • Choose Energy

  • In 2011, I found Dominion to be the most competitive electric provider at 8.87 cents per kWh.

    On September 20, 2012, I made the necessary phone calls and filled out paperwork to switch my energy provider from Dominion Energy to Castlebridge Energy Group. This reduced our electricity rate from 8.87 cents per kilowatt hour to 7.79. Of course Dominion had an introductory offer they wanted to extend to me but it wasn't as low as that of Castlebridge. I also switched my tenant's gas provider from BGE to Castlebridge, thereby reducing their rate from 56.63 cents per therm to 51. Overall, this means a 12% savings in electricity and a 10% savings in gas. This considers only electricity and gas, not fees or taxes.

    In late January 2014, I switch my electric supplier from Castlebridge to Constellation. This was a two year contract that locked my electric rates in for 8.59 cents per kilowatt hour. This was much higher than our previous rate with Castlebridge which was 7.79 center per kilowatt hour but we also got a $50 gift card. Considering how little electricity we pay for, we clearly came out ahead on this one. My tenants got 8.49 cents per kilowatt hour and 58.9 cents per therm. So not as good of a rate for them but certainly better than what the competition was offering.

    I did some switching which I failed to document but the process is similar:
  • Find a new provider with a better rate.
  • Wait for your current contract to end.
  • Switch providers.

  • The whole "switching providers" process is easy and transparent as long as you pay attention to the terms of your agreement.

    On March 14, 2017, I switched energy providers at both my Savage and Hanover homes. I called Clearview Energy, who had been providing electricity over the last several months at a rate of $0.0849/kWh. I asked them to cancel my service at both homes until the new provider took over. Next I called Shipley Energy, who had been providing gas at the townhouse over the last several months at a variable rate, with the latest being $0.5613/therm. I also asked them to cancel my service until the new provider took over.
    I then signed an 18 month fixed rate contract with Direct Energy. This contract is called "Live Brighter 18." It gives me electricity at $0.0769/kWh. This means a savings of about 9.4%. This is for both houses. I also signed a 24 month fixed rate contract with Constellation. It gives me gas at the townhouse for $0.519/therm. This means a savings of about 7.5% if compared to the last month's rate.

    On August 22, 2018, I switched my electrical energy provider back to Constellation. I reduced my rate and got a $100 gift card. Another thing that helped me save money was making use of RetailMeNot - Energy Coupon Codes. The best energy provider won't always be the same. I look for a long contract, a fixed rate, and gift cards. The choices were overwhelming but at the time, I was able to narrow my search significantly by limiting things to Direct Energy, Constellation, ClearView, Plymouth Rock, Shipley, Spark, WGL, and TownSquare.

    In 2021, my contract with Constellation ended and I ended up paying Constellation without a contract. My electric cost per kWh went from 33% from $0.0729 to $0.0969. After checking the competition, I went with the Spark Energy 12 month fixed plan which was $0.074 per kWh. Here are the runners up: Tomorrow Energy Corp, Major Energy, and Direct Energy Services. National Gas & Electric looked good at first but they have a monthly base fee. This might be fine if you use a lot of electricity but I don't think it would be worth it for us. The price for Standard Offer Service (SOS) through BGE is $0.0833 per kWh, effective through May 31, 2022. That is 12.5% higher than the Spark Energy 12 month fixed plan rate.

    I made a huge mistake regarding the previous paragraph. Constellation did an automatic renewal of my contract. There was a grace period but I let it slip by. By switching to Spark Energy, I got hit with a $150 early cancellation fee. I reviewed my contract and indeed, I was at fault. Pay attention to the grace period! That was a hard lesson to learn.
    Close accordion icon

    Peak RewardsOpen accordion icon
    In 2011, I familiarized myself with Peak Rewards, a program offered by BGE to reduce stress on the power grid when demand is greatest. You may qualify depending if you have electric heating/cooling and/or electric water heating. There are other factors too, such as the size of your system. I've never had a problem with this.
    Close accordion icon

    Increasing the value of your home?Open accordion icon
    One thing that was not considered by Solar Energy World was the increase in the resale value of my property. According to Econ 101: Solar panels increase home values (a broken link as of 2023), photovoltaic solar panels increase home values by 3.5% in California. But keep in mind that this study was done using data in California...and not just any part of California but San Diego and Sacramento, which are known for being extremely sunny. Conversely, according to a now broken link from 2011 called Do Solar Panels Increase Home Value? real estate agents in the less sunny San Francisco area have a different opinion.
    "My experience has been that [solar panels] do not add value...the sales price on two [homes with solar] I sold did not increase in spite of heavy marketing about the panels," said David Bergman, Silicon Valley real estate agent with Intero Real Estate Services.

    How would Maryland compare? My guess is that when it comes to solar panels, we have more in common with San Francisco than Sacramento or San Diego.


    In September 2013, I read in the "2013 Maryland Tour of Solar and Green Homes" booklet that
    Experts estimate that the value of a property with a photovoltaic system is increased by 20 times the yearly electricity savings.

    Unfortunately, this was a blanket statement...not one that was specific to a particular region. But if we assume that it is correct, my home will have increased in value 20 * ($556 + $350) = $18,120 as a result of the photovoltaic solar panels. This accounts for the 16 panels on my garage installed in 2010 and the 10 panels installed on my house in 2013.


    I tend to feel that the aesthetic value of your home may change depending on the location of your panels. I don't particularly find solar panels attractive. But ours are not very noticeable so I don't feel that is an issue. But for some places, it could make it more difficult to sell a home.
    Close accordion icon


     Miscellaneous

    Roof steepnessOpen accordion icon
    It was great showing my parents my solar panels during their December 16-21, 2010 visit. Unfortunately, my panels were covered with snow for the first few days. I noticed that my neighbors' panels had no snow on them while mine were still halfway covered. I attribute this to their roof being angled much more steeply than mine.

    In 2014, our winter was the coldest I can ever remember. When we get snow, it tends to stick around meaning that my solar panels aren't earning their keep. If we had a steeper roof, the snow wouldn't stick around so long. The slope of our house roof that supports the Suniva panels is 27 degrees and the solar access is 89%.
    Snow on our house panels

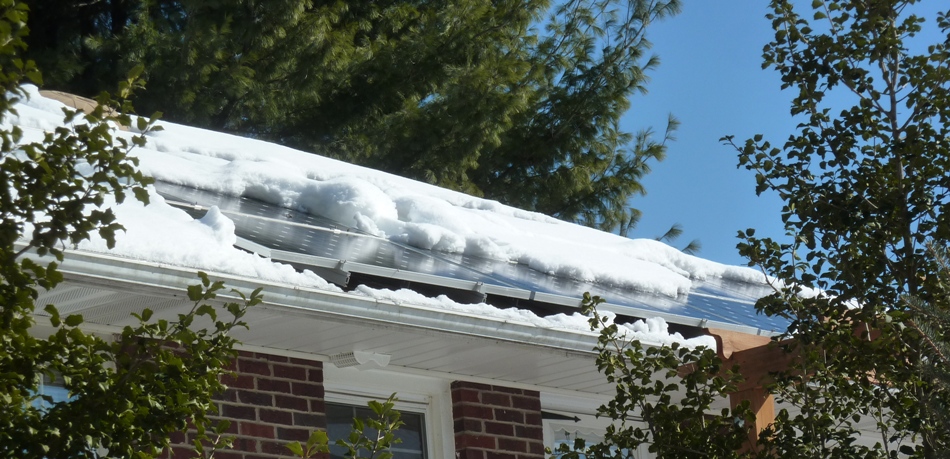
    For the garage, which supports the SunPower panels, the slope is 17 degrees and the solar access is 98%. There is a pretty obvious difference in how much snow remains when comparing the two.
    Snow on our garage panels

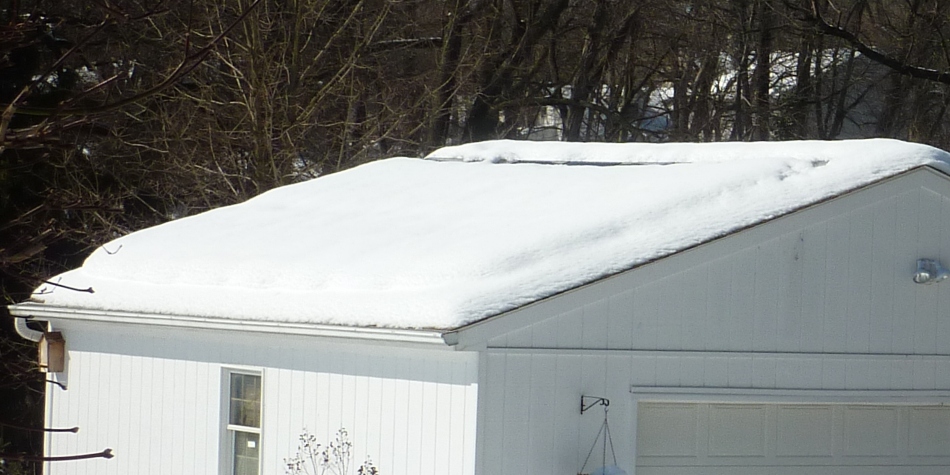
    My neighbor across the street has a roof with a slope of 45 degrees and solar access of about 92%. Their Mage panels have no snow when my Sunivas have about 40% snow coverage and my SunPowers have about 95% snow coverage. Like my SunPowers, my neighbor's roof faces south (an azimuth of 170 degrees). All these pics were taken around the same time on February 14, 2014.
    No snow on my neighbor's panels

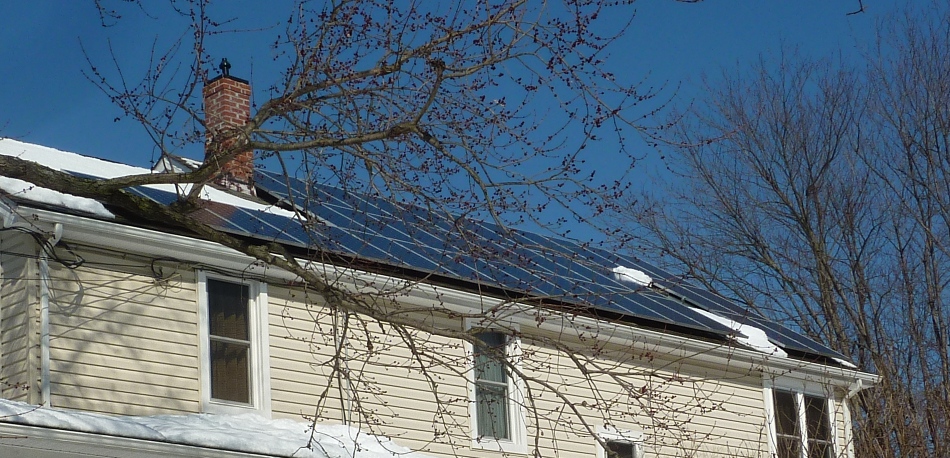
    So just what is the ideal slope for solar panels? That all depends on where you live. According to "Optimum Tilt of Solar Panels" (now a broken link),
    If your solar panels will have a fixed tilt angle, and you want to get the most energy over the whole year, then this section is for you. A fixed angle is convenient, but note that there are some disadvantages. As mentioned above, you'll get less power than if you adjusted the angle. Also, if you live where there is snow, adjusting the panels to a steeper angle in winter makes it more likely that they will shed snow. A panel covered in snow produces little or no power.
    Use one of these formulas to find the best angle from the horizontal at which the panel should be tilted:
  • If your latitude is below 25 degrees, use the latitude times 0.87.
  • If your latitude is between 25 and 50 degrees, use the latitude, times 0.76, plus 3.1 degrees.
  • If your latitude is above 50 degrees, see Other Situations below. [referenced in broken link]

  • Baltimore has a latitude of 39.2833 north. So the ideal slope for solar panels in the Baltimore area is (39.2833 x 0.76) + 3.1 = 32.9553 degrees.
    Close accordion icon

    Understanding your energy billOpen accordion icon
    Our cost for electricity in 2014 was $0.0859 per kWh. This was a variable cost since it was based on the number of kWh we consumed. There were also taxes or fees which were variable. These total $0.03634 per kWh bringing the total variable cost to $0.12224 per kWh.

    There was also a fixed fee of $7.86 that is not dependent on how much energy we use. Even if we use no energy, we still have to pay the fixed fee every month. This is a delivery charge.

    If you use gas, then there is a separate delivery charge for that. Gas is a cheap heating source when you use it but the problem is that if you only use it for heating your house and you have a public gas line, then you are paying for the delivery charge year round, even if you only use it in the winter. My advice is if you have a public gas line, then use gas for as much stuff as you can: cooking, heating water, and drying your clothes. Otherwise, consider obtaining your own tank and having it refilled.

    So how much of our bill goes to pay for these "other" costs, meaning the bill that isn't just for electricity (or gas, if we had it)? This can vary throughout the year. You just need to closely examine your energy bill to find out.

    If you have solar photovoltaic panels or generate your own electricity via other means to reduce your utility cost, then variable costs are good because they are a function of how much electricity we use. If solar offsets our electric usage, then our usage could be zero, meaning that our variable costs would also be zero.

    In contrast, fixed costs are bad if you generate your own electricity because even if you don't use any electricity, you're still paying the fixed cost. Where my parents live, in California, they have much higher fixed costs in their utility bill so there isn't as much incentive for them to have solar photovoltaic panels.
    Close accordion icon

    Darkest summerOpen accordion icon
    The summer of 2018 was the darkest summer in Savage, ever!!! Maybe not "ever" but at least since 2011...and I have the data to prove it.

    In 2010, 16 SunPower photovoltaic solar panels were installed on the south-facing roof of my garage. Then in 2013, I had 10 Suniva photovoltaic solar panels installed on the west-facing roof my house. That same year, I had an AET/Vaughn thermal solar panel installed on the south-facing roof of my house to heat water.

    Here's the data provided by my SunPower interface. Listed below are the number of kilowatts of electricity generated by my SunPower panels from June 21 to September 22 for each year below.
  • 2011: 1,502
  • 2012: 1,539
  • 2013: 1,528
  • 2014: 1,655
  • 2015: 1,557
  • 2016: 1,550
  • 2017: 1,405
  • 2018: 1,306

  • Clearly, my SunPower panels have generated the least amount of electricity in the summer of 2018. I didn't bother to list the Suniva data but I expect it to support this observation. It typically generates 60-65% as much electricity as my SunPower panels.

    Fortunately, my geothermal heating and cooling system isn't affected by all the cloud cover and rain we've been having.

    The screenshot below shows the amount of electricity generated by my SunPower photovoltaic panels since it became operational on November 30, 2010.
    SunPower web page screenshot showing the amount of electricity generated by my SunPower photovoltaic panels since it became operational on November 30, 2010

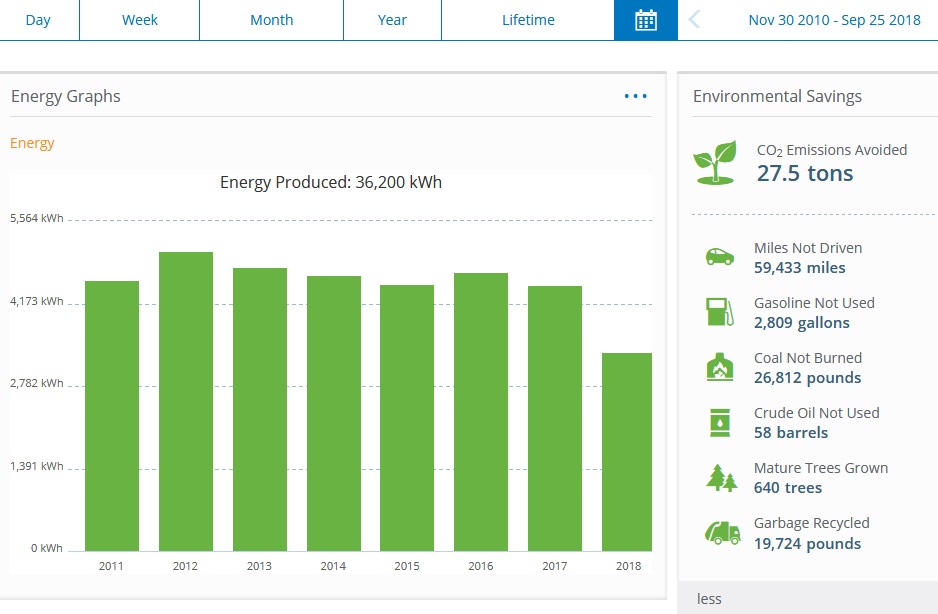
    By far, 2018 was Baltimore's wettest year on record. Baltimore's weather record book goes back to 1871.
    - from "The Baltimore Sun - 2018 was Baltimore's wettest year on record"

    Solar photovoltaic panels aren't just a means to generate electricity, they are also an objective means of collecting certain types of weather data.
    Close accordion icon

    HeatOpen accordion icon
    Sunny days are obviously good for solar photovoltaic panels to generate electricity. All things being equal, how does heat come into play? Are sunny hot days better than sunny cool days? The answer is no.

    There are a lot of electrical components in a solar photovoltaic system and anyone that works around computers will tell you that heat makes them not function as efficiently as cold. I do not have any information to quantify this.

    Note that this statement applies to solar photovoltaic and not solar thermal systems.
    Close accordion icon

    Maryland Tour of Solar and Green HomesOpen accordion icon
    On October 6, 2013, our house was recognized as one of 48 on the "4th Annual Maryland Tour of Solar and Green Homes." This means it was listed in a booklet and open to the public for the afternoon. What makes our home green? We use solar photovoltaic panels, solar thermal hot water heater, geothermal heat pump, rain barrels, extra insulation in the attic, composting, and a pellet stove which burns fuel made from sawdust and other wood waste. All this in a home built in 1952! The event was a success. I had about 25 attendees, mostly neighbors, co-workers, and kayakers, and there was never any down time. It lasted from 1100 to 1800.
    Close accordion icon

    Rental propertyOpen accordion icon
    I have considered getting photovoltaic panels for my rental townhouse, which I purchased new on January 22, 2007. But the problem (as of 2011) is that rental properties are not eligible for the 30% federal tax credit. But I am eligible for a tax refund since it is a business expense. But this means that for a $32,292 system, instead of getting back $9,688 as a federal tax credit, I would only get $6,458 (20%).

    One issue with townhomes is that the ratio of roof space to living space is small. So if you have a lot of space to heat, cool, and live, then you'll find your solar panel real estate quite limited. Regardless of how many panels you get, you still need an inverter and infrastructure. So to maximize your bang for the buck, it makes sense to get a lot of panels...enough to make your home as close to net zero as possible. This will be challenging for a house with a relatively small roof.

    I ended up selling my townhouse on June 30, 2021.
    Close accordion icon

    SquirrelsOpen accordion icon
    In January 2014, I learned that some people are having problems with squirrels chewing through the wires that connect to their solar panels.
  • Why squirrels are nuts about solar panels
  • Squirrels Under the Solar Panels

  • Fortunately, this has not been a problem for me or anyone that I know.
    Close accordion icon